S&P 500 Price Analysis: Bombs away, perhaps not too far away
- The bulls are n charge, but for how long will sellers wait to emerge again?
- Watching for distribution and fundamentals to finally marry.

There is an overwhelming argument for the downside in US benchmarks, from both a technical and fundamental standpoint.
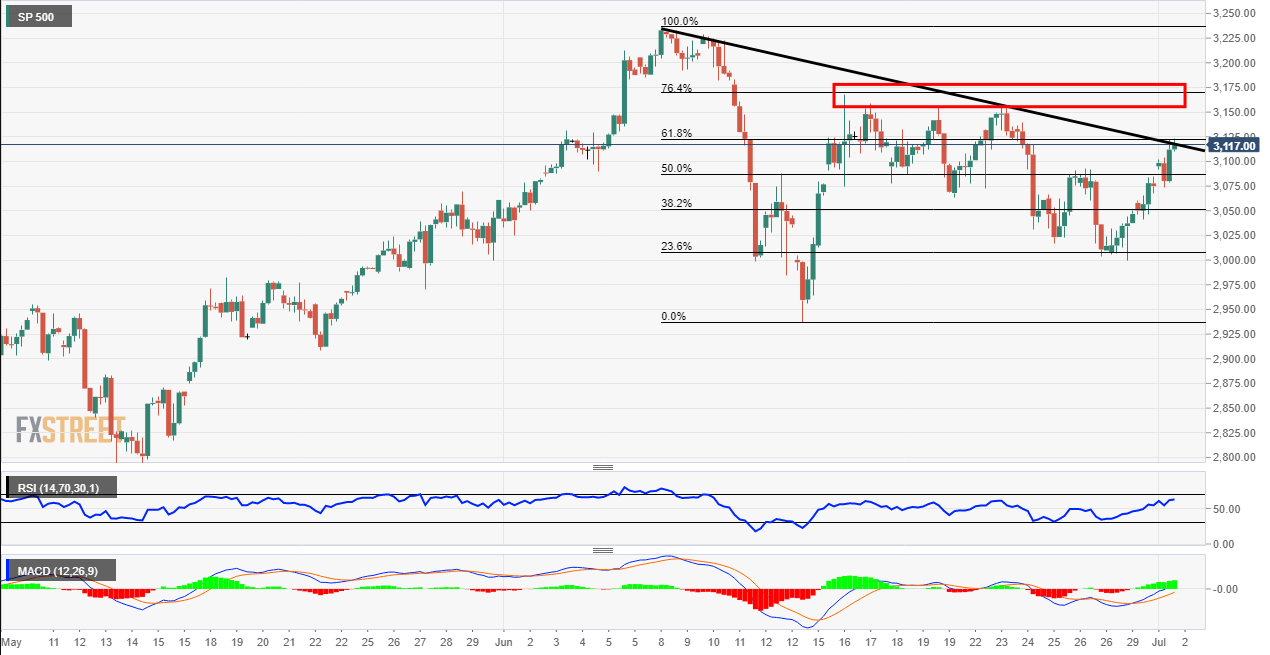
Looking to the S&P 500, from a 4-HR term perspective, however, Rajan Dhall, MSTA and analyst at FXStreet offered a bullish scenario as follows:
S&P 500 Price Analysis: This intraday trendline break could signal higher prices ahead
While this is a plausible scenario, it does not necessarily equate for the next leg of the recovery.
A 61.8% Fibonacci was supported of the latest bullish impulse within the bullish recovery, so a bullish bias is in play.
It should be noted that a symmetrical triangle can lead to a break out either way, but for now, we can stick to the long side playbook.
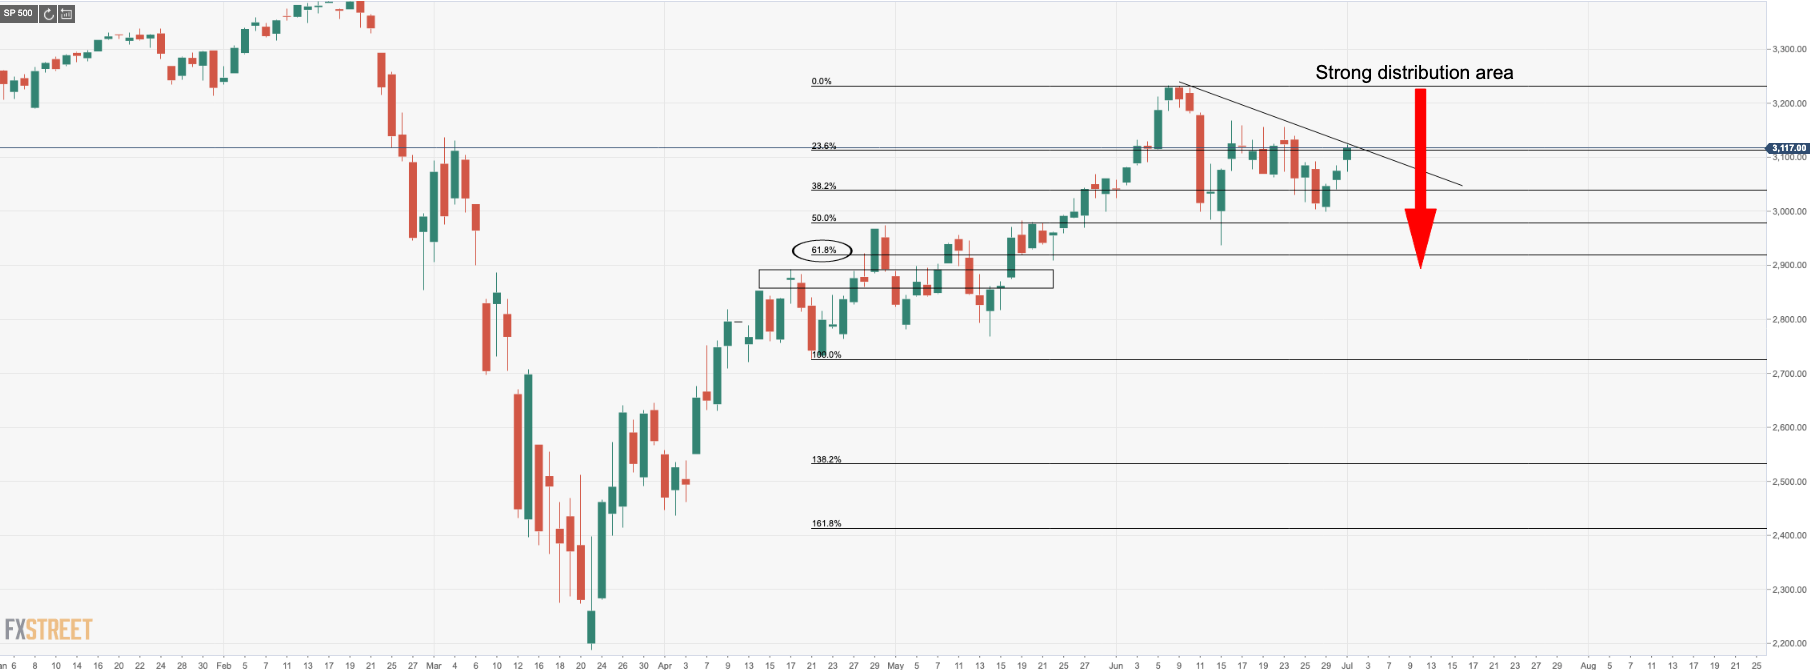
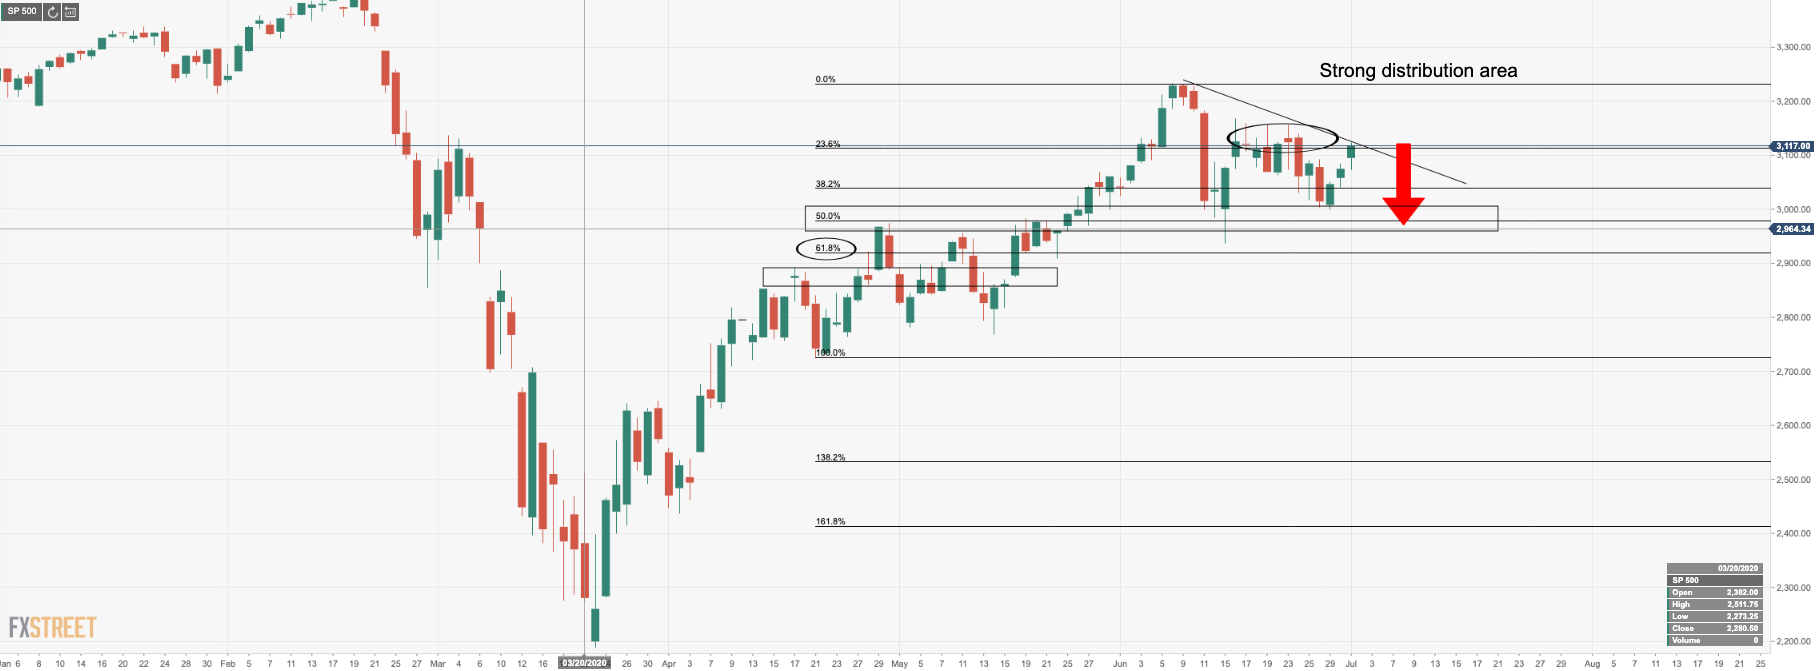
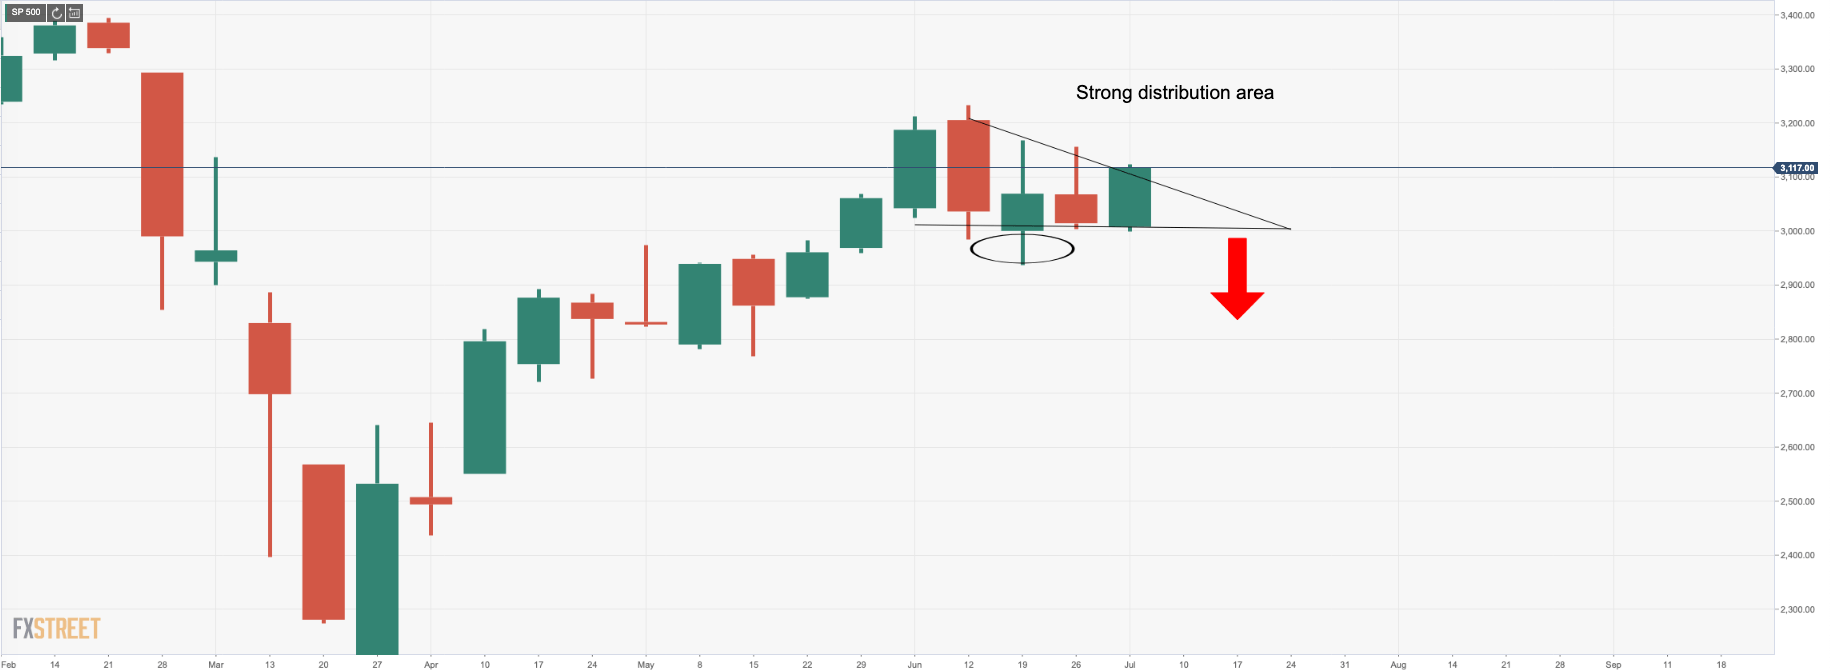
As buyers lose faith in rejections at the strong distribution area, stopping volume could be the theme which would likely lead to run back to test the tops of the bodies of the 15 and 22 June weekly candlesticks:
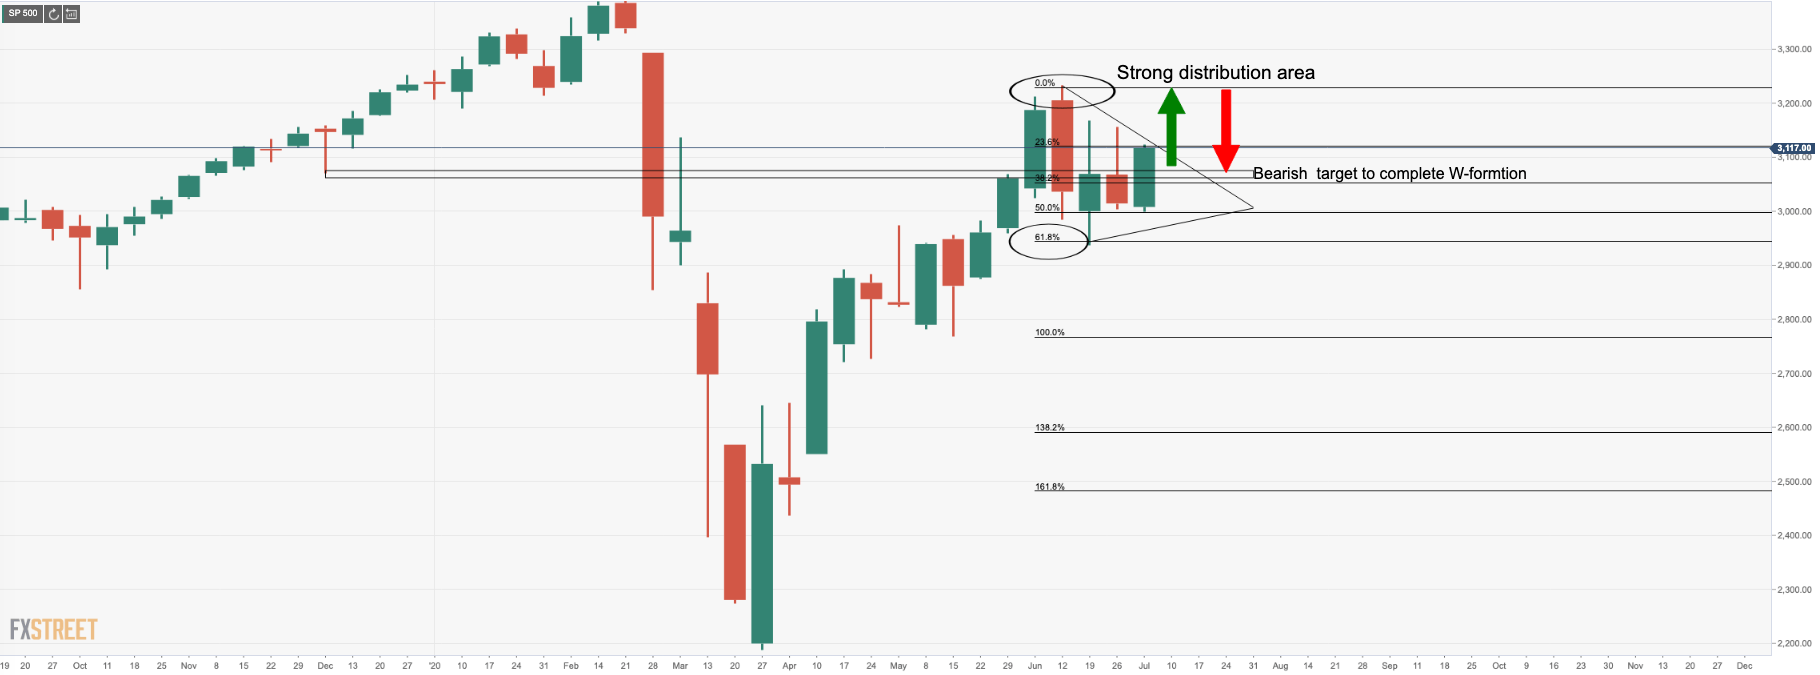
On a continued failure on the top side, buyers will dry up and a prolonged period of distribution could well be the next chapter on Wall Street.
Hindsight is a wonderful thing
Lastly, hindsight is a wonderful thing.
Technical analysis is perspective, and subjectivity certainly plays a role.
At the end of the day, none of this is 100% full proof and traders are rarely accurate. The real job of a technician is to be wrong less frequently and the job of a trader is to play the laws of probability into their favour.
While the above chart certainly looks like a symmetrical triangle, what if it's not?
If the price doesn't manage a breakout to the topside, technicians could well be charting up a descending triangle instead, choosing to ignore the outside downside weekly bar:
Bombs away!!
The descending triangle is a bearish formation and can at times be a reversal pattern at the end of an uptrend.
Regardless of where they form, descending triangles are bearish patterns that indicate distribution.
S&P 500 to rally 11% within twelve months
Meanwhile, in a post from Bank of America, their "Sell Side Indicator" is up to 55.8% from 54.9% in June which is implying an 11% rally over the next 12 months. In other words, another 345 points to 34,60 at today's prices.
- "This indicator is the most bullish of our five target models and continues to indicate that sentiment on stocks is still tepid, far from the euphoria one sees at the end of bull markets"
- "The dividend yield of the S&P 500 is now at a multi-decade record multiple of bond yields, and whereas the sustainability of dividends has come into question amid the recession, we think a significant proportion of the S&P 500 offers sustainable dividend yields"
Author

Ross J Burland
FXStreet
Ross J Burland, born in England, UK, is a sportsman at heart. He played Rugby and Judo for his county, Kent and the South East of England Rugby team.