|

S&P 500: Falls for the second day in a row, bears eye the 100-DMA at 4,370

  • Wall Street leading indices are barely down as the week kicks in.
  • Energy stocks keep in the green as crude oil continues its advance.

US stock indices are declining during the New York session amid thin liquidity conditions with the money markets (US Bond market) closed for the observation of Columbus Day in the US. The S&P 500 is down 0.10%, at 4,388.26, the Dow Jones Industrial Average slides 0.16% at 34,691.57, and the tech-heavy Nasdaq Composite slumps 0.04%, sitting at 14,814.58, at press time.

Among the 11 sectors, Energy is rising 0.17% on the back of higher crude oil prices, with the Western Texas Intermediate (WTI) advancing almost 2%, trading at $80.65. On the other hand, Financials are down 0.11%, despite higher US bond yields and the Federal Reserve QE reduction prospects.

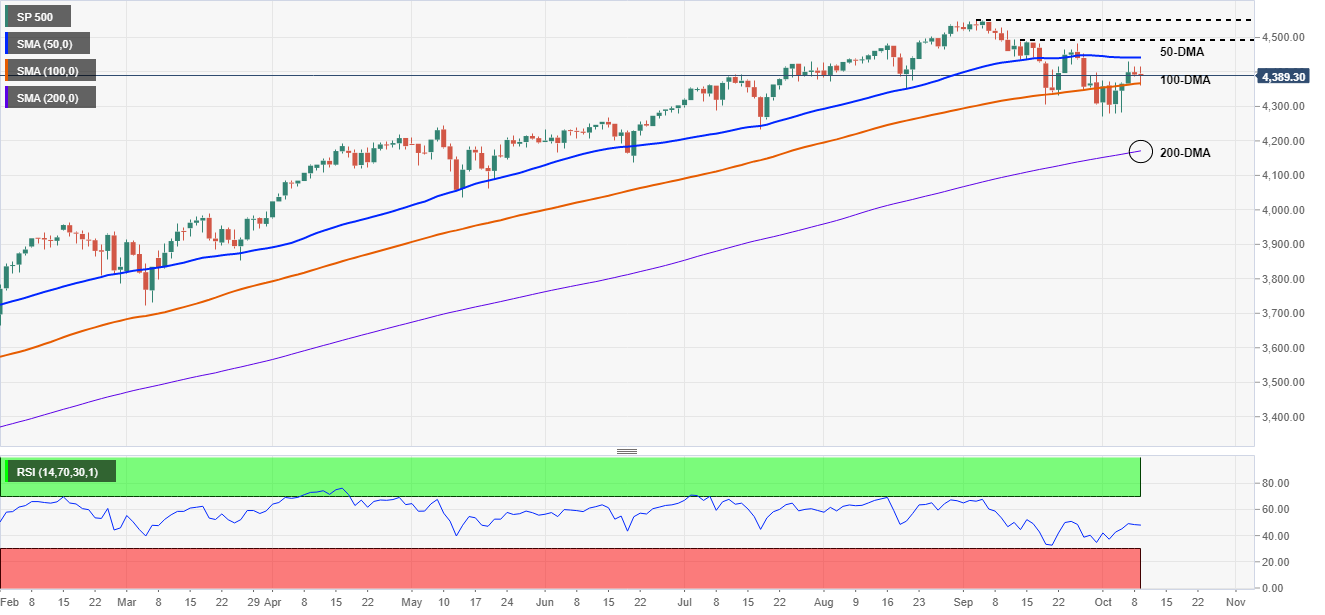
S&P 500 Price Forecast: Technical outlook

Daily chart

The S&P 500 retreated from yearly highs around 4,549, down the July 8 swing lows around  4,270. However, in the last week, the 100-day moving average (DMA) reclaimed around 4,370, boosts the prospects of “buying the dip.”

In the S&P 500, a break above the 50-day moving average at 4,442 could open the door for a re-test of the 2021 year highs. In case of that outcome, the following resistance level would be 4,482, and then 4,550 2021 highs.

On the flip side, failure at the 50-DMA coupled with a break below the 100-DMA could accelerate the fall towards the 200-DMA at 4,172 and beyond.

The Relative Strength Index (RSI) is at 48, indicating that downward pressure remains, opening the door of another leg down, perhaps towards the 200-DMA.

KEY ADDITIONAL LEVELS TO WATCH

SP 500

Overview
Today last price4388
Today Daily Change-4.50
Today Daily Change %-0.10
Today daily open4392.5
 
Trends
Daily SMA204397.72
Daily SMA504441.9
Daily SMA1004364.65
Daily SMA2004163.47
 
Levels
Previous Daily High4416.7
Previous Daily Low4385.5
Previous Weekly High4430.8
Previous Weekly Low4278.4
Previous Monthly High4550.75
Previous Monthly Low4304.4
Daily Fibonacci 38.2%4397.42
Daily Fibonacci 61.8%4404.78
Daily Pivot Point S14379.77
Daily Pivot Point S24367.03
Daily Pivot Point S34348.57
Daily Pivot Point R14410.97
Daily Pivot Point R24429.43
Daily Pivot Point R34442.17

Author

Christian Borjon Valencia

Christian Borjon began his career as a retail trader in 2010, mainly focused on technical analysis and strategies around it. He started as a swing trader, as he used to work in another industry unrelated to the financial markets.

More from Christian Borjon Valencia
Share:

Markets move fast. We move first.

Orange Juice Newsletter brings you expert driven insights - not headlines. Every day on your inbox.

By subscribing you agree to our Terms and conditions.

Editor's Picks

EUR/USD drops to daily lows near 1.1630

EUR/USD now loses some traction and slips back to the area of daily lows around 1.1630 on the back of a mild bounce in the US Dollar. Fresh US data, including the September PCE inflation numbers and the latest read on December consumer sentiment, didn’t really move the needle, so the pair is still on course to finish the week with a respectable gain.

GBP/USD trims gains, recedes toward 1.3320

GBP/USD is struggling to keep its daily advance, coming under fresh pressure and retreating to the 1.3320 zone following a mild bullish attempt in the Greenback. Even though US consumer sentiment surprised to the upside, the US Dollar isn’t getting much love, as traders are far more interested in what the Fed will say next week.

Gold makes a U-turn, back to $4,200

Gold is now losing the grip and receding to the key $4,200 region per troy ounce following some signs of life in the Greenback and a marked bounce in US Treasury yields across the board. The positive outlook for the precious metal, however, remains underpinned by steady bets for extra easing by the Fed.

Crypto Today: Bitcoin, Ethereum, XRP pare gains despite increasing hopes of upcoming Fed rate cut

Bitcoin is steadying above $91,000 at the time of writing on Friday. Ethereum remains above $3,100, reflecting positive sentiment ahead of the Federal Reserve's (Fed) monetary policy meeting on December 10.

Week ahead – Rate cut or market shock? The Fed decides

Fed rate cut widely expected; dot plot and overall meeting rhetoric also matter. Risk appetite is supported by Fed rate cut expectations; cryptos show signs of life. RBA, BoC and SNB also meet; chances of surprises are relatively low.

Ripple faces persistent bear risks, shrugging off ETF inflows

Ripple is extending its decline for the second consecutive day, trading at $2.06 at the time of writing on Friday. Sentiment surrounding the cross-border remittance token continues to lag despite steady inflows into XRP spot ETFs.