|

S&P 500 enters correction territory, ending Friday just shy of $4,100

  • The S&P 500 is extending declines into a two-week stretch, down over 5% for the period.
  • S&P index down over 10% from the July peak at $4,600, enters correction territory.
  • US Equities mixed on Friday as recession fears, lopsided earnings reports drag on stocks.

The Standard & Poor's index marked in the second losing week in a row, entering correction territory after falling 10% from July's high near $4,600.

The S&P 500 index closed Friday down around 20 points, shedding half a percent close out at $4,117.37, with the Dow Jones Industrial Average sinking over 366 points to shed 1.12%, closing Friday at $32417.59.

The NASDAQ Composite index bucked the bearish trend for Friday, closing up 47.41 points to end the day up almost 0.4%, closing at $12,643 plus one penny.

Equities got pushed broadly lower as inflation continues to remain a sticky problem for the Federal Reserve (Fed), with the US Personal Consumption Expenditure (PCE) Index showed consumer price spending rise by its fastest month-on-month pace since May, with the annual PCE cooling slightly into September, bringing "higher for longer" interest rate concerns back to the forefront.

The Fed is slated for another rate call next Wednesday, and while money markets are pricing in an expected rate hold next week, odds of an additional rate hike at December are steadily rising as the US economy remains firm compared to global competitors and inflation remains stubbornly higher than expected.

S&P Technical Outlook

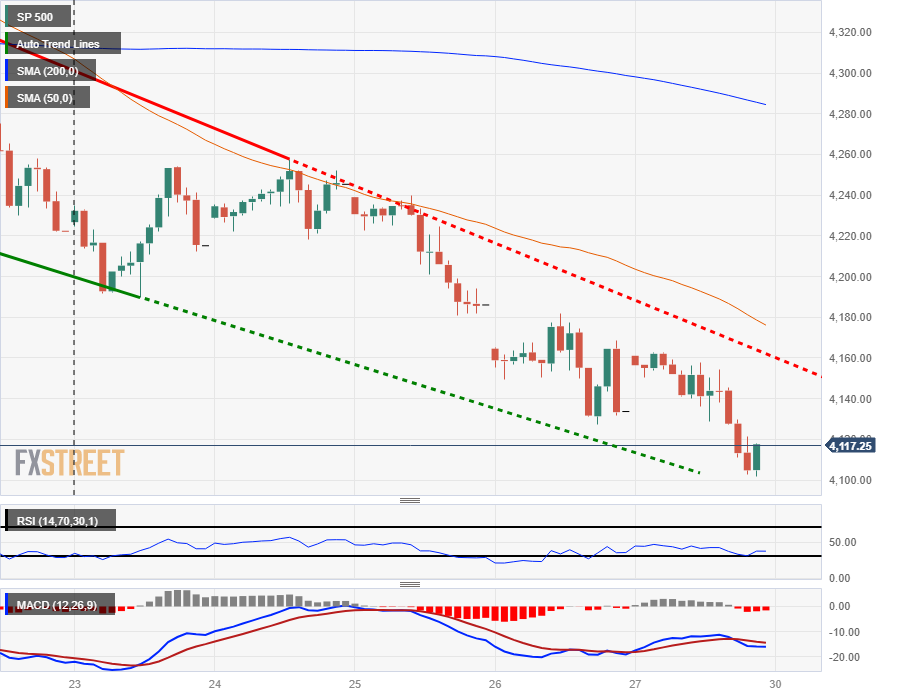
The S&P stopped just short of slipping back into $4,100 in Friday's mostly bearish trading, and the major equity index continues to backslide, entering correction territory from July's peaks, and the S&P has locked in two consecutive weeks of red on the charts.

Daily candlesticks have tumbled past the 200-day Simple Moving Average (SMA) as bearish momentum firms up on the chart paper, and the last swing high into $4,400 sees added technical resistance from the 50-day SMA, currently settling into $4,350.

S&P Hourly Chart

S&P Technical Levels

SP 500

Overview
Today last price4117.25
Today Daily Change-16.69
Today Daily Change %-0.40
Today daily open4133.94
 
Trends
Daily SMA204284.72
Daily SMA504367.85
Daily SMA1004411.69
Daily SMA2004247.95
 
Levels
Previous Daily High4182.1
Previous Daily Low4127.41
Previous Weekly High4391.32
Previous Weekly Low4222.22
Previous Monthly High4538.24
Previous Monthly Low4237.48
Daily Fibonacci 38.2%4148.3
Daily Fibonacci 61.8%4161.21
Daily Pivot Point S14113.53
Daily Pivot Point S24093.13
Daily Pivot Point S34058.84
Daily Pivot Point R14168.22
Daily Pivot Point R24202.51
Daily Pivot Point R34222.91

Author

Joshua Gibson

Joshua joins the FXStreet team as an Economics and Finance double major from Vancouver Island University with twelve years' experience as an independent trader focusing on technical analysis.

More from Joshua Gibson
Share:

Markets move fast. We move first.

Orange Juice Newsletter brings you expert driven insights - not headlines. Every day on your inbox.

By subscribing you agree to our Terms and conditions.

Editor's Picks

EUR/USD climbs to multi-week tops near 1.1700

EUR/USD rapidly leaves behind four consecutive daily pullbacks, challenging the 1.1700 hurdle in response to the severe sell-off in the Greenback as investors continued to evaluate the Fed’s rate cut and the neutral message from Chief Powell. Next on tap on the docket will be the weekly US labour market report on Thursday.

GBP/USD pressures intraday highs as USD gains downward traction

GBP/USD gains upward traction as the USD eased following the Federal Reserve decision to trim the benchmark interest rate by 25 bps. FOMC divided, Summary of Economic Projections shows no relevant changes.

Gold extends gains beyond $4,230 in the Fed’s aftermath

Gold prices are up after the US central bank's monetary policy announcement, trading around $4,230 as Asian traders reach their desks. A better market mood limits demand for the safe-haven metal, but broad US Dollar weakness skews the risk to the upside. 

Ethereum eyes $3,470 as ETF inflows show returning demand, derivatives remain muted

Traditional investors are playing a key role in Ethereum's (ETH) recent recovery after weeks on the sidelines. Ethereum exchange-traded funds (ETFs) drew in $177.6 million on Tuesday, marking a second consecutive day of positive performance and their highest inflow since October 28, according to SoSoValue data.

Fed projects only 50 bps of additional rate cuts between 2026 and 2027; lifts GDP forecasts

The Federal Open Market Committee’s (FOMC) latest dot plot, released on Wednesday, indicates that interest rates will average 3.4% by the end of 2026, in line with the September projection.

Hyperliquid eyes $30 breakout despite declining staking balance

Hyperliquid is trading above $28.00 at the time of writing on Wednesday, after rebounding from support at $27.50. The broader cryptocurrency market is characterised by widespread intraday losses ahead of the Fed monetary policy decision.