|

S&P 500 consolidates as US Dollar and yields recover

  • The S&P 500 is flat around 4,785.
  • Market expectations of 160 bps easing in 2024 by the Fed ignited the flows to stocks in the last sessions.
  • The Index is up by more than 20% in 2023.

In Friday's session, the S&P 500 index stands at 4,785.50 as bullish momentum seems to be flatting in the last trading day of 2023. In that sense, the stock index will close a 24% yearly gain and tallies its ninth consecutive winning week, so downward movements may be on the horizon to consolidate gains.

Recently, capital flows were redirected to stocks as at its final 2023 meeting, the Federal Reserve recognized an inflation deceleration, assuring no rate increases in 2024 and hinting at a 75 bps adjustment. As interest rates and stocks are negatively correlated, the expectations of a less aggressive Fed next year made riskier assets rally.

In the meantime, US yields are consolidating near multi-month lows. The 2-year rate stands at 4.29%, while the 5 and 10-year yields are observed at 3.87%, all three with slight gains and with upward movements seem to limit the upside for the stock index. In addition, the US Dollar measured by the DXY index also recovered and jumped to 101.35, which also presents a challenge to the S&P.

In the first week of 2024, the United States is set to release data related to its employment sector, a critical resource for gauging economic health, which may have an impact on Fed expectations. Those reports include December's Nonfarm Payrrol report, the Average Hourly Earning, and the Unemployment Rate, all closely followed by the Fed.

S&P 500 levels to watch

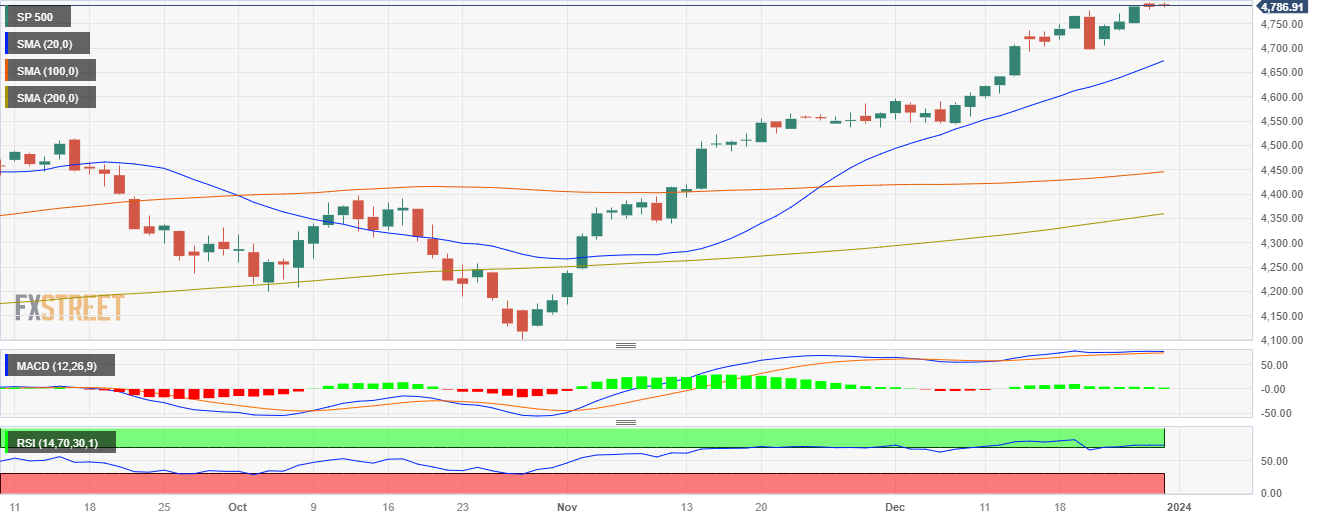
The daily chart indicates a conflict between short- and long-term market forces, precipitating volatile conditions. Evidently, the Relative Strength Index (RSI) presents flat overbought conditions, signaling an impending bearish shift as traders may look to sell to realize their profits. However, the Moving Average Convergence Divergence (MACD) histogram's flat, yet green bars point toward the bulls retaining some of their momentum.

In a broader context, the index's position above the 20, 100, and 200-day Simple Moving Averages (SMAs) mirrors a bullish outlook in the longer term. Despite any short-term fluctuations, the weight of these SMAs suggests that the buying force currently holds significant sway over the index's ongoing trend. Thus, the bullish traction should not be underestimated in the coming trading sessions.

S&P 500 daily chart

SP 500

Overview
Today last price4786.57
Today Daily Change1.85
Today Daily Change %0.04
Today daily open4784.72
 
Trends
Daily SMA204682.28
Daily SMA504506.17
Daily SMA1004448.6
Daily SMA2004364.69
 
Levels
Previous Daily High4793.64
Previous Daily Low4780.08
Previous Weekly High4776.48
Previous Weekly Low4696.28
Previous Monthly High4586.39
Previous Monthly Low4171.91
Daily Fibonacci 38.2%4785.26
Daily Fibonacci 61.8%4788.46
Daily Pivot Point S14778.65
Daily Pivot Point S24772.59
Daily Pivot Point S34765.09
Daily Pivot Point R14792.21
Daily Pivot Point R24799.71
Daily Pivot Point R34805.77

Author

Patricio Martín

Patricio is an economist from Argentina passionate about global finance and understanding the daily movements of the markets.

More from Patricio Martín
Share:

Markets move fast. We move first.

Orange Juice Newsletter brings you expert driven insights - not headlines. Every day on your inbox.

By subscribing you agree to our Terms and conditions.

Editor's Picks

EUR/USD moves sideways below 1.1800 on Christmas Eve

EUR/USD struggles to find direction and trades in a narrow channel below 1.1800 after posting gains for two consecutive days. Bond and stock markets in the US will open at the usual time and close early on Christmas Eve, allowing the trading action to remain subdued. 

GBP/USD keeps range around 1.3500 amid quiet markets

GBP/USD keeps its range trade intact at around 1.3500 on Wednesday. The Pound Sterling holds the upper hand over the US Dollar amid pre-Christmas light trading as traders move to the sidelines heading into the holiday season. 

Gold retreats from record highs, trades below $4,500

Gold retreats after setting a new record-high above $4,520 earlier in the day and trades in a tight range below $4,500 as trading volumes thin out ahead of the Christmas break. The US Dollar selling bias remains unabated on the back of dovish Fed expectations, which continues to act as a tailwind for the bullion amid persistent geopolitical risks.

Bitcoin slips below $87,000 as ETF outflows intensify, whale participation declines

Bitcoin price continues to trade around $86,770 on Wednesday, after failing to break above the $90,000 resistance. US-listed spot ETFs record an outflow of $188.64 million on Tuesday, marking the fourth consecutive day of withdrawals.

Economic outlook 2026-2027 in advanced countries: Solidity test

After a year marked by global economic resilience and ending on a note of optimism, 2026 looks promising and could be a year of solid economic performance. In our baseline scenario, we expect most of the supportive factors at work in 2025 to continue to play a role in 2026.

Avalanche struggles near $12 as Grayscale files updated form for ETF

Avalanche trades close to $12 by press time on Wednesday, extending the nearly 2% drop from the previous day. Grayscale filed an updated form to convert its Avalanche-focused Trust into an ETF with the US Securities and Exchange Commission.