S&P 500 closes at all-time high in Friday risk rally led by tech sector rip
- US indexes climbed on Friday, led by chip makers.
- Investors have pivoted to tech shares to shake off Fed rate tantrum.
- Markets go haywire as the US Dollar, US equities, and Treasury yields all rise.

The Standard & Poor’s drove to a new all-time high of $4,839.58 on Friday as equities broadly rallied as investors pile into future earnings bets on large-cap tech stocks, with chip-makers loosely associated with AI tech projects leading the charge.
Money markets are broadly shaking off months of begrudgingly giving up ground on rate cut expectations from the Federal Reserve (Fed). According to the CME’s FedWatch tool, rate swap bets are pricing in nearly a 40% chance of a rate cut at the Fed’s March policy meeting, down significantly from over a 70% chance just a month ago.
Fed officials have been pushing back against market expectations of an increased pace of rate cuts from the US central bank, and markets appear to finally be listening as US economic data continues to thump market forecasts, printing consistently higher and healthier than investors were hoping for as markets yearn for cheaper lending and borrowing costs.
US Consumer Sentiment improved to its best reading since July of 2021 according to the University of Michigan’s consumer sentiment survey. The UoM’s 5-year Consumer Inflation Expectations Survey in January also declined to familiar lows at 2.8% from December’s 2.9%.
With the US economy continuing to bump along at a healthy clip and US consumers expecting inflation to remain above the Fed’s 2% target for the foreseeable future, market hopes of Fed rate cuts are unlikely to see a happy conclusion, with money markets now leaning into the FOMC’s May meeting as a possible start to the next cutting cycle.
The Dow Jones Industrial Average (DJIA) also rose to an all-time high, touching $37,931.36 and wrapping up Friday at $37,863.80, climbing over 395 points and gaining 1.05% on the day.
The NASDAQ Composite and NASDAQ 100 indexes hit their own all-time highs on Friday, with the NASDSAQ Composite climbing 255.32 to $15,310.97 to a Friday gain of 1.7% while the NASDAQ 100 soared 1.75% to end at $17,316.87, up over 296 points.
S&P 500 Technical Outlook
The S&P 500 major equity index climbed nearly one and a quarter percent to hit an all-time high of its own, ending Friday at $4,839.81, up 58.87 points on the day.
Near-term bullish momentum in equity indexes has sent the S&P well above any technical zones and pinning into record peaks. The S&P could decline over 8% and still be in bull country above the 200-day Simple Moving Average (SMA) near $4,400.00, and the closest technical barrier sits at the 50-day SMA near $4,650.00.
S&P 500 Hourly Chart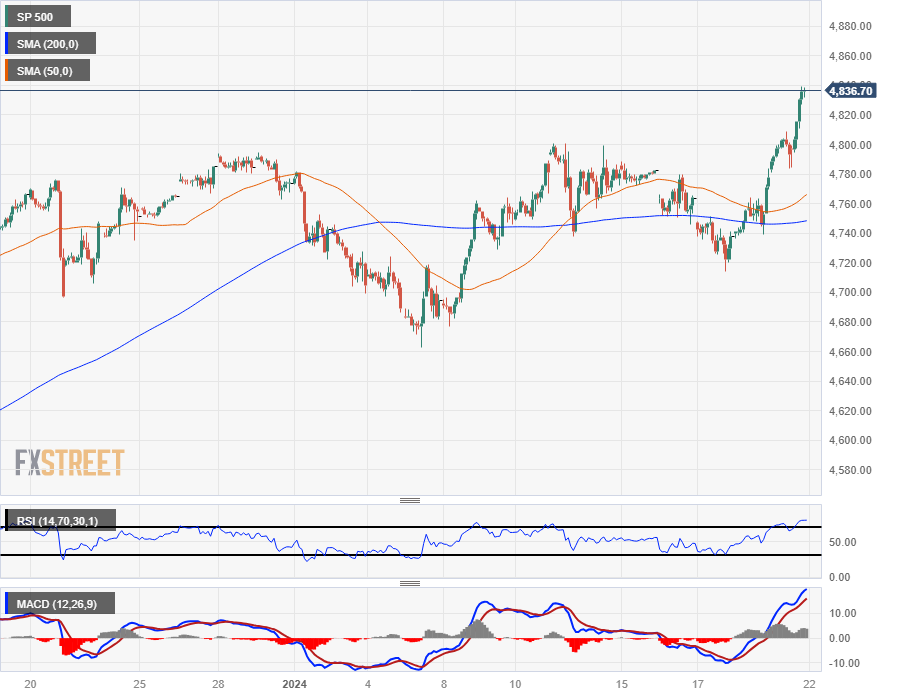
S&P 500 Daily Chart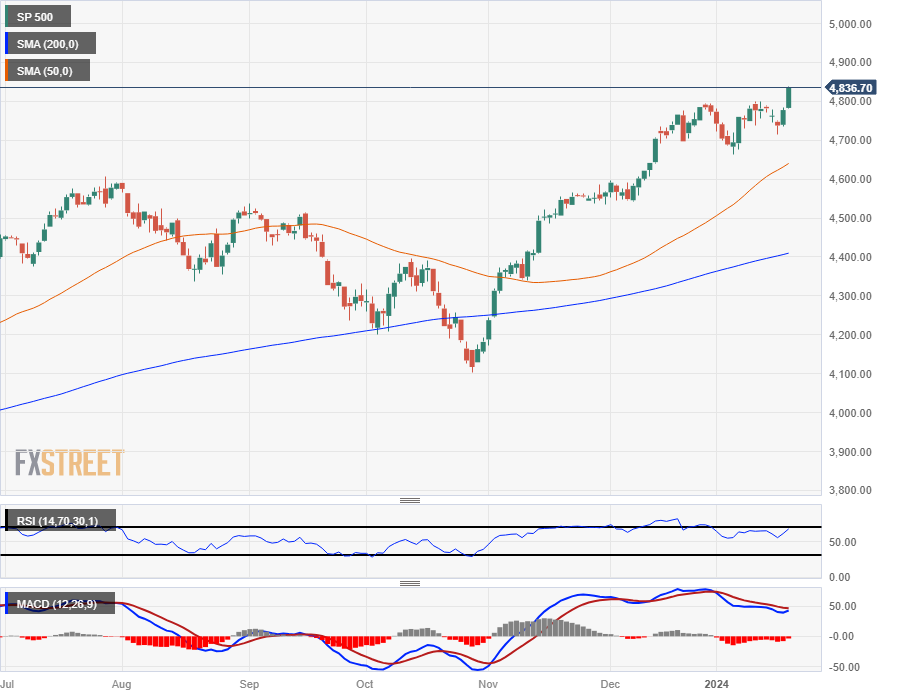
Author

Joshua Gibson
FXStreet
Joshua joins the FXStreet team as an Economics and Finance double major from Vancouver Island University with twelve years' experience as an independent trader focusing on technical analysis.


