|

Silver Price Forecast: XAG/USD struggles at $24.00 as traders book profits amid tensions in Ukraine

  • Silver retreats from weekly tops around $24.00 as the Russian President recognize Donetsk and Luhansk as independent states.
  • The white-metal falls despite a weaker US dollar across the board.
  • XAG/USD Technical Outlook: Faces strong resistance around $24.00-$24.25 area.

Silver (XAG/USD) retreats from $24.00 despite growing concerns in geopolitical jitters in Eastern Europe. At the time of writing, XAG/USD is trading at $23.90.

Russia’s signed a decree recognizing Donetsk and Luhansk as independent states

War concerns between Russia and Ukraine increase. In the last couple of hours, amid a US bank holiday, the conflict in Eastern Europe grabs all the attention. Leaders from two Eastern Ukraine separatist regions urged Russian President Vladimir Putin, who, at 18:00 GMT, signed a decree recognizing them as independent states.

That said, the XAG/USD barely blinked at the reaction of the headline crossing the wires, steady around the $23.80 region.

During the overnight session for North American traders, the white metal failed to gain acceptance above the $24.00 mark, protected above by a ten-month-old downslope trendline and the 200-day moving average (DMA) at $24.25. It is worth noting that based on the price action, the $0,15 mean reversion move could be attributed to profit-taking, as the non-yielding metal, as shown by the 1-hour chart, stalled at the 50-hour moving average (HMA) around $23.86.

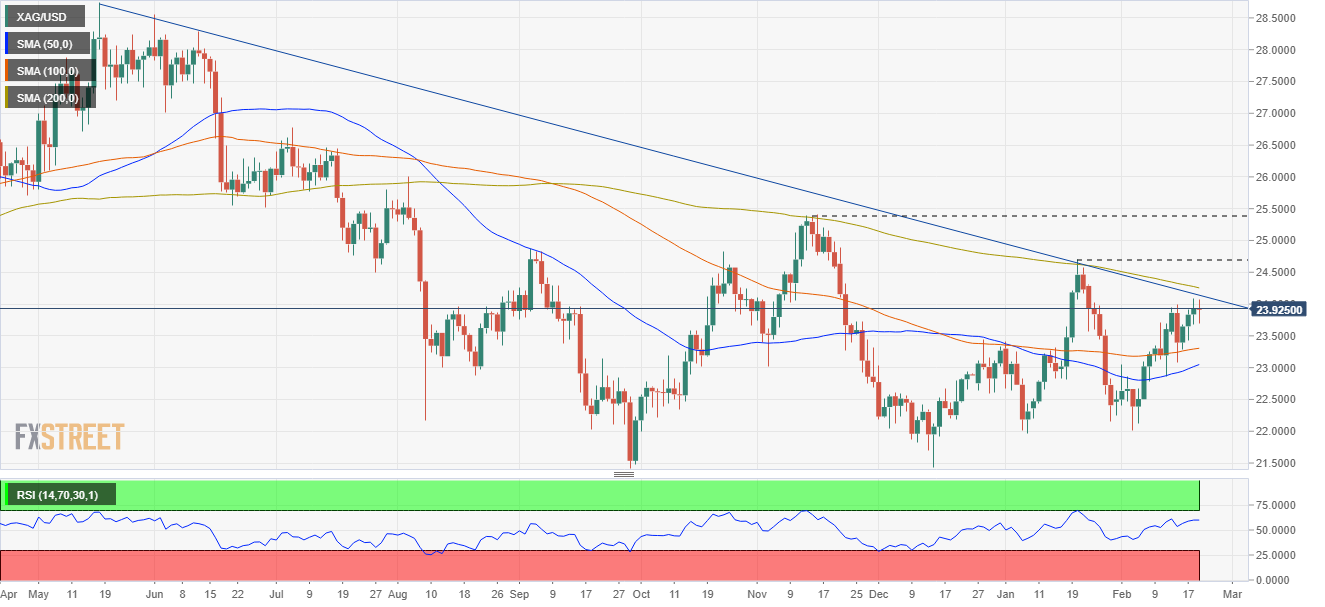
XAG/USD Price Forecast: Technical outlook

XAG/USD is neutral biased, depicted by the daily chart. The shorter time-frame daily moving averages (DMAs) reside below the spot price, indicating that XAG/USD aims upward. However, the presence of a ten-month-old trendline around the $24.00 mark, alongside the 200-DMA at $24.25, would be crucial resistance levels to overcome for XAG bulls if they would like to aim higher.

At press time, XAG/USD first resistance would be $24.00. Once cleared, it would expose the 200-DMA at $24.25. Breach of the latter would pave the way towards last year’s November 16 daily high at $25.40.

XAG/USD

Overview
Today last price23.9
Today Daily Change-0.02
Today Daily Change %-0.08
Today daily open23.92
 
Trends
Daily SMA2023.2
Daily SMA5023.02
Daily SMA10023.29
Daily SMA20024.27
 
Levels
Previous Daily High24.09
Previous Daily Low23.68
Previous Weekly High24.09
Previous Weekly Low23.08
Previous Monthly High24.7
Previous Monthly Low21.96
Daily Fibonacci 38.2%23.93
Daily Fibonacci 61.8%23.84
Daily Pivot Point S123.71
Daily Pivot Point S223.5
Daily Pivot Point S323.31
Daily Pivot Point R124.11
Daily Pivot Point R224.3
Daily Pivot Point R324.52

Author

Christian Borjon Valencia

Markets analyst, news editor, and trading instructor with over 14 years of experience across FX, commodities, US equity indices, and global macro markets.

More from Christian Borjon Valencia
Share:

Editor's Picks

AUD/USD eyes 0.7150 barrier nine-day EMA

AUD/USD inches higher after registering modest losses in the previous day, trading around 0.7130 during the Asian hours. The technical analysis of the daily chart indicates that the pair is moving sideways within the rectangle pattern, suggesting a consolidation as neither the bulls nor the bears have enough momentum to take control of the market.

USD/JPY trades below 160.00 intervention threshold; bullish bias intact

The USD/JPY pair attracts some sellers during the Asian session amid fears that authorities will step in again to prop up the Japanese Yen. Furthermore, the Israel-Lebanon truce prompts some profit-taking around the US Dollar and exerts downward pressure on the currency pair.

Gold puts its 200-day SMA to the test near $4,420

Gold keeps the bullish stance in place in the latter part of Thursday’s session, although a convincing break above the key $4,500 mark per troy ounce still remains elusive. The precious metal’s advance comes amid the resurgence of some selling interest around the Greenback, improving risk sentiment, and declining US Treasury yields across the board.

Bitcoin’s massive storm is back: Why the sell-off is far from over

Bitcoin price action over the last few weeks has felt less like a normal, healthy correction and more like a slow grinding crash that continues to wreak havoc on holdings and trading accounts. And everything suggests that the dramatic crash isn’t over.

Nonfarm payrolls: Testing the limits of Fed policy patience

The upcoming nonfarm payrolls report for May will provide the final update on the US labor market before Kevin Warsh attends his first policy meeting as the new Fed Chair later this month.

Recession on paper: What really moves the Canadian Loonie now?

Statistics Canada handed the headline writers a gift and the analysts a headache. Real GDP shrank 0.1% on an annualized basis in the first quarter, and with the fourth quarter of 2025 revised down to a 1.0% contraction, that is two negative quarters in a row, the textbook definition of a technical recession and Canada's first since the pandemic.