Silver Price Forecast: XAG/USD rebounds toward $30 as bulls defend key support
- Silver bounces from $28.33 after failed bearish breakout, reclaiming $29.80 with eyes set on $30.00 resistance.
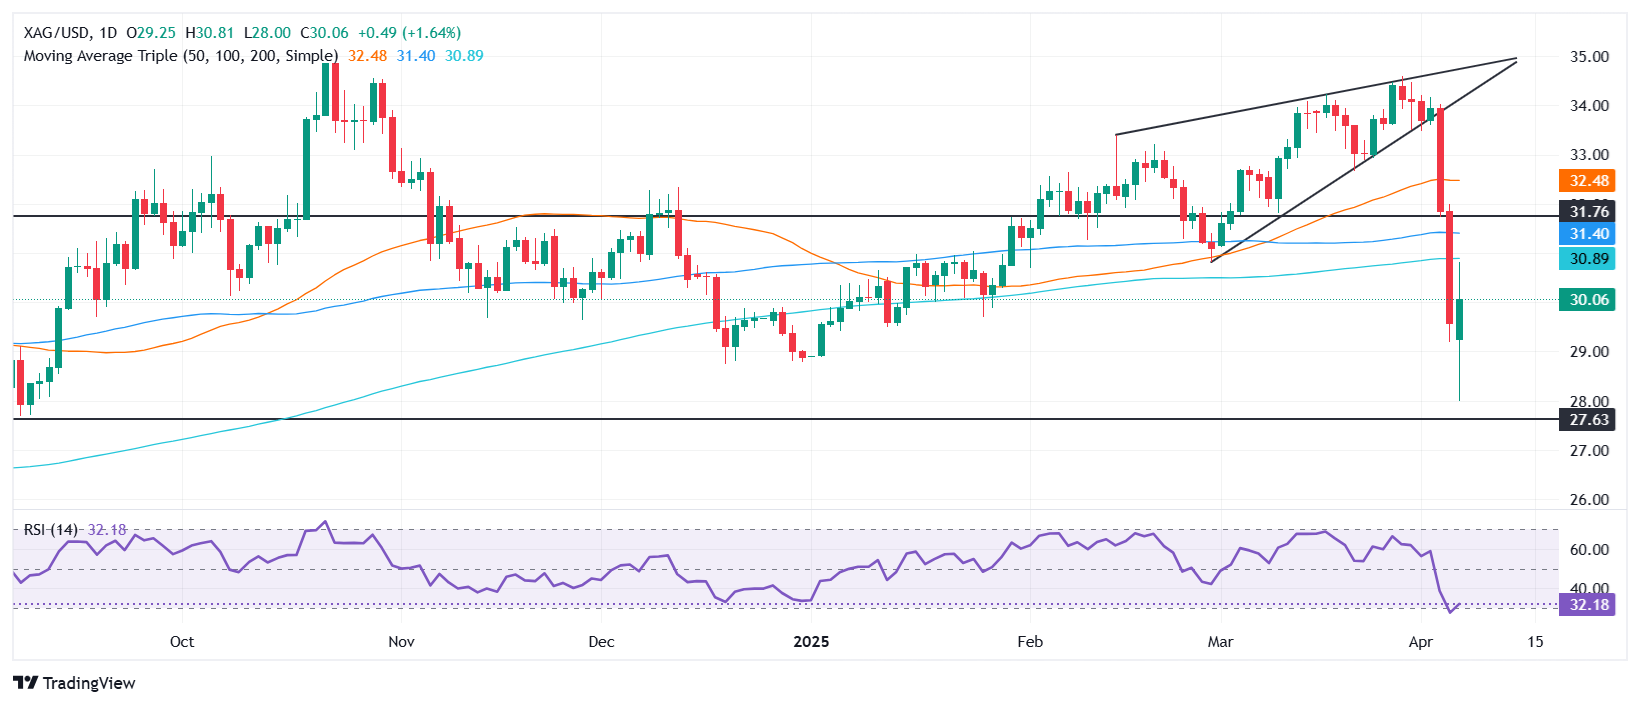
- Technical setup turns bullish as RSI exits oversold territory and hammer pattern signals momentum shift.
- Daily close above $29.70 could open door to $30.87 (200-day SMA), while downside risk emerges below $29.50.

Silver price sellers failed to decisively clear support at $28.75 daily, and buyers stepped in near yearly lows of $28.33, pushing the grey metal’s price back above $29.80 with traders eyeing the $30.00 mark. At the time of writing, XAG/USD trades at $29.89, up 0.89%.
XAG/USD Price Forecast: Technical outlook
Silver’s downtrend stalled and it might be poised for a leg-up due to some technical factors: the formation of a hammer, and the Relative Strength Index (RSI) exiting oversold conditions, with the index punching above the 30 level, a signal that usually is bullish for traders.
Furthermore, XAG/USD trades above the January 25 low of $29.70, and a daily close above the latter could sponsor a test of the $30.00 level. Once cleared, the next stop would be the 200-day Simple Moving Average (SMA) at $30.87, followed by the $31.00 mark.
On the other hand, a drop below $29.50 could pave the way for further downside, with the next support being $29.00, followed by the year-to-date (YTD) low of $28.33.
XAG/USD Price Chart – Daily
Silver FAQs
Silver is a precious metal highly traded among investors. It has been historically used as a store of value and a medium of exchange. Although less popular than Gold, traders may turn to Silver to diversify their investment portfolio, for its intrinsic value or as a potential hedge during high-inflation periods. Investors can buy physical Silver, in coins or in bars, or trade it through vehicles such as Exchange Traded Funds, which track its price on international markets.
Silver prices can move due to a wide range of factors. Geopolitical instability or fears of a deep recession can make Silver price escalate due to its safe-haven status, although to a lesser extent than Gold's. As a yieldless asset, Silver tends to rise with lower interest rates. Its moves also depend on how the US Dollar (USD) behaves as the asset is priced in dollars (XAG/USD). A strong Dollar tends to keep the price of Silver at bay, whereas a weaker Dollar is likely to propel prices up. Other factors such as investment demand, mining supply – Silver is much more abundant than Gold – and recycling rates can also affect prices.
Silver is widely used in industry, particularly in sectors such as electronics or solar energy, as it has one of the highest electric conductivity of all metals – more than Copper and Gold. A surge in demand can increase prices, while a decline tends to lower them. Dynamics in the US, Chinese and Indian economies can also contribute to price swings: for the US and particularly China, their big industrial sectors use Silver in various processes; in India, consumers’ demand for the precious metal for jewellery also plays a key role in setting prices.
Silver prices tend to follow Gold's moves. When Gold prices rise, Silver typically follows suit, as their status as safe-haven assets is similar. The Gold/Silver ratio, which shows the number of ounces of Silver needed to equal the value of one ounce of Gold, may help to determine the relative valuation between both metals. Some investors may consider a high ratio as an indicator that Silver is undervalued, or Gold is overvalued. On the contrary, a low ratio might suggest that Gold is undervalued relative to Silver.
Author

Christian Borjon Valencia
FXStreet
Markets analyst, news editor, and trading instructor with over 14 years of experience across FX, commodities, US equity indices, and global macro markets.


