- XAG/USD surpasses monthly highs amid positive market sentiment, despite the rising US Dollar.
- US Core PCE was below estimates, opening the door for a less aggressive Fed.
- XAG/USD Price Analysis: Expected to continue its rally and test the YTD high of $24.63
Silver price trades at new monthly highs above $24.00 a troy ounce, sponsored by falling US Treasury bond yields. Sentiment continues to be the main driver in the session, with US equities set to finish the month with gains. At the time of writing, the XAG/USD is trading at $24.10, gaining 0.89%.
Fed's Collins welcomed inflation data, but reiterated the Fed's has work left to do
Wall Street continues to print gains across the board. The greenback is pressured by data from the United States (US), which showed inflation tempering; therefore, less aggression by the US Federal Reserve (Fed) is needed.
The Department of Commerce (DoC) featured the Fed’s preferred gauge for inflation, the Core Personal Consumption Expenditure (PCE) for February, which rose by 4.6% YoY, below estimates of 4.7%, while the headline inflation dropped from 5.3% to 5% YoY.
Consequently, US Treasury bond yields edged lower, a tailwind for the white metal, which pushed through the $24.00 threshold for the first time since February 2. The US 10-year Treasury bond yield dropped four basis points (bps) at 3.516%, while US Real Yields stood at 1.26% as of March 30.
In the meantime, the University of Michigan (UoM) Consumer Sentiment for March was lower than expected, at 62, as opposed to the foreseen 67. Moreover, the survey updated that American consumers revised their inflation expectations downward. For the one-year horizon, the estimated inflation rate is 3.6%, while for the 5-year horizon, consumers estimate inflation to be 2.9%.
On the central bank side, Boston Fed’s President Susan Collins said that PCE inflation data is positive news, yet there’s still more work to do to bring inflation towards the 2% target.
XAG/USD Technical analysis
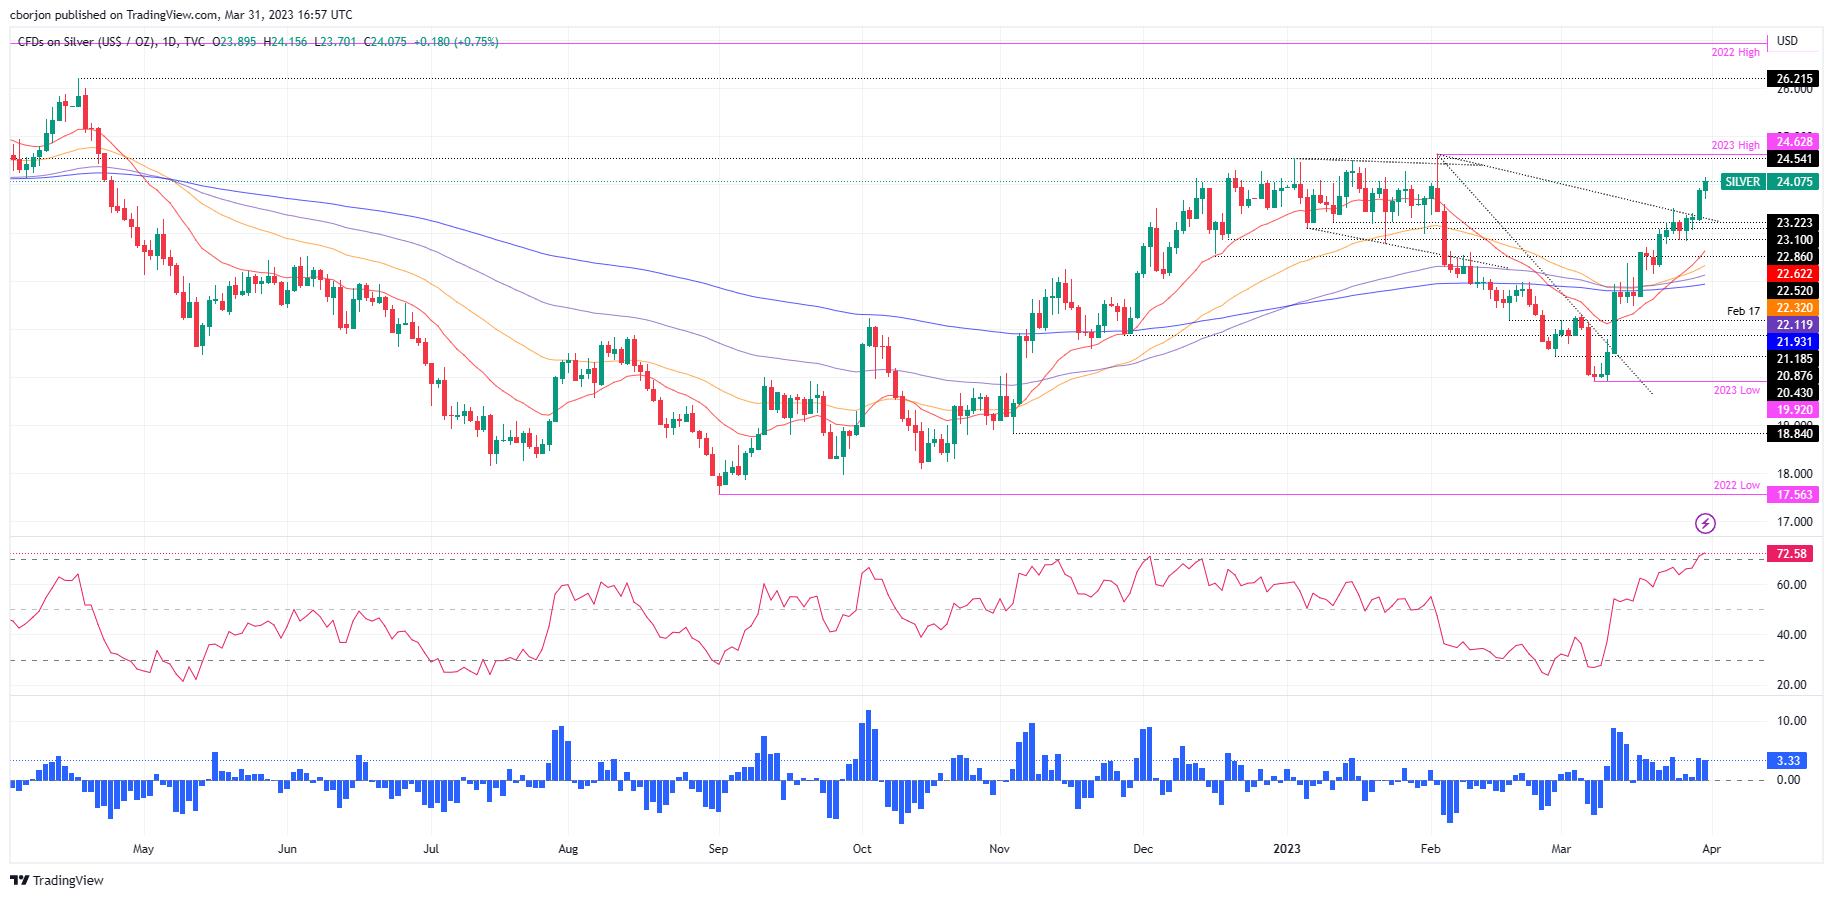
Given the backdrop, the XAG/USD is set to extend its rally and test the YTD high at $24.63. The Relative Strength Index (RSI), albeit at overbought conditions, backed the uptrend, while the Rate of Change (RoC) portrays buyers piled around the $22.00 area. The XAG/USD might consolidate as the RSI exits from overbought conditions, as buyers prepare to assault $25.00. if the XAG/USD clears $24.63, the psychological $25.00 barrier would be exposed. Once cleared, on April 18, 2022, resistance at $26.21 is next.
Information on these pages contains forward-looking statements that involve risks and uncertainties. Markets and instruments profiled on this page are for informational purposes only and should not in any way come across as a recommendation to buy or sell in these assets. You should do your own thorough research before making any investment decisions. FXStreet does not in any way guarantee that this information is free from mistakes, errors, or material misstatements. It also does not guarantee that this information is of a timely nature. Investing in Open Markets involves a great deal of risk, including the loss of all or a portion of your investment, as well as emotional distress. All risks, losses and costs associated with investing, including total loss of principal, are your responsibility. The views and opinions expressed in this article are those of the authors and do not necessarily reflect the official policy or position of FXStreet nor its advertisers. The author will not be held responsible for information that is found at the end of links posted on this page.
If not otherwise explicitly mentioned in the body of the article, at the time of writing, the author has no position in any stock mentioned in this article and no business relationship with any company mentioned. The author has not received compensation for writing this article, other than from FXStreet.
FXStreet and the author do not provide personalized recommendations. The author makes no representations as to the accuracy, completeness, or suitability of this information. FXStreet and the author will not be liable for any errors, omissions or any losses, injuries or damages arising from this information and its display or use. Errors and omissions excepted.
The author and FXStreet are not registered investment advisors and nothing in this article is intended to be investment advice.
Recommended content
Editors’ Picks
EUR/USD remains stuck near 1.0800 after US employment data

EUR/USD struggles to find direction and moves up and down in a narrow channel at around 1.0800 in the American session on Wednesday. The data from the US showed that employment in the private sector rose less than expected in November and helped the pair limit its losses.
GBP/USD battles 1.2600 after US ADP data

GBP/USD is having a difficult time stabilizing above 1.2600 after closing the first two trading days of the week in negative territory. Despite the weaker-than-expected ADP Employment Change data, the US Dollar stays relatively resilient amid cautious market stance.
Gold rebounds to $2,030 as US yields stretch lower

Gold recovered toward $2,030 after testing $2,020 earlier in the day. The benchmark 10-year US Treasury bond yield declined to its lowest level in three months below 4.15% after US employment data and helped XAU/USD gain traction.
Bitcoin-based meme coin ORDI price action wobbles after 1,100% rally

The Bitcoin-based BRC-20 meme coin, which had people confused as being an actual valuable token, is now slowly creeping up to that status. ORDI price rise over the past couple of days has been astonishing, and with BTC driving the price and crossing $44,000, ORDI is also gaining rapidly. But not for long.
The Dollar is struggling to trend

For the last three trading sessions, the dollar index has been crossing up and down the 200-day moving average every day. All in all, the flirting with this level has been going on for more than three weeks, during which neither bulls nor bears were able to form a stable trend.