|

Silver Price Forecast: $30.0 appears a tough nut to crack for XAG/USD

  • Silver price edges higher near $29.40 Wednesday’s Asian session, up 0.40% on the day. 
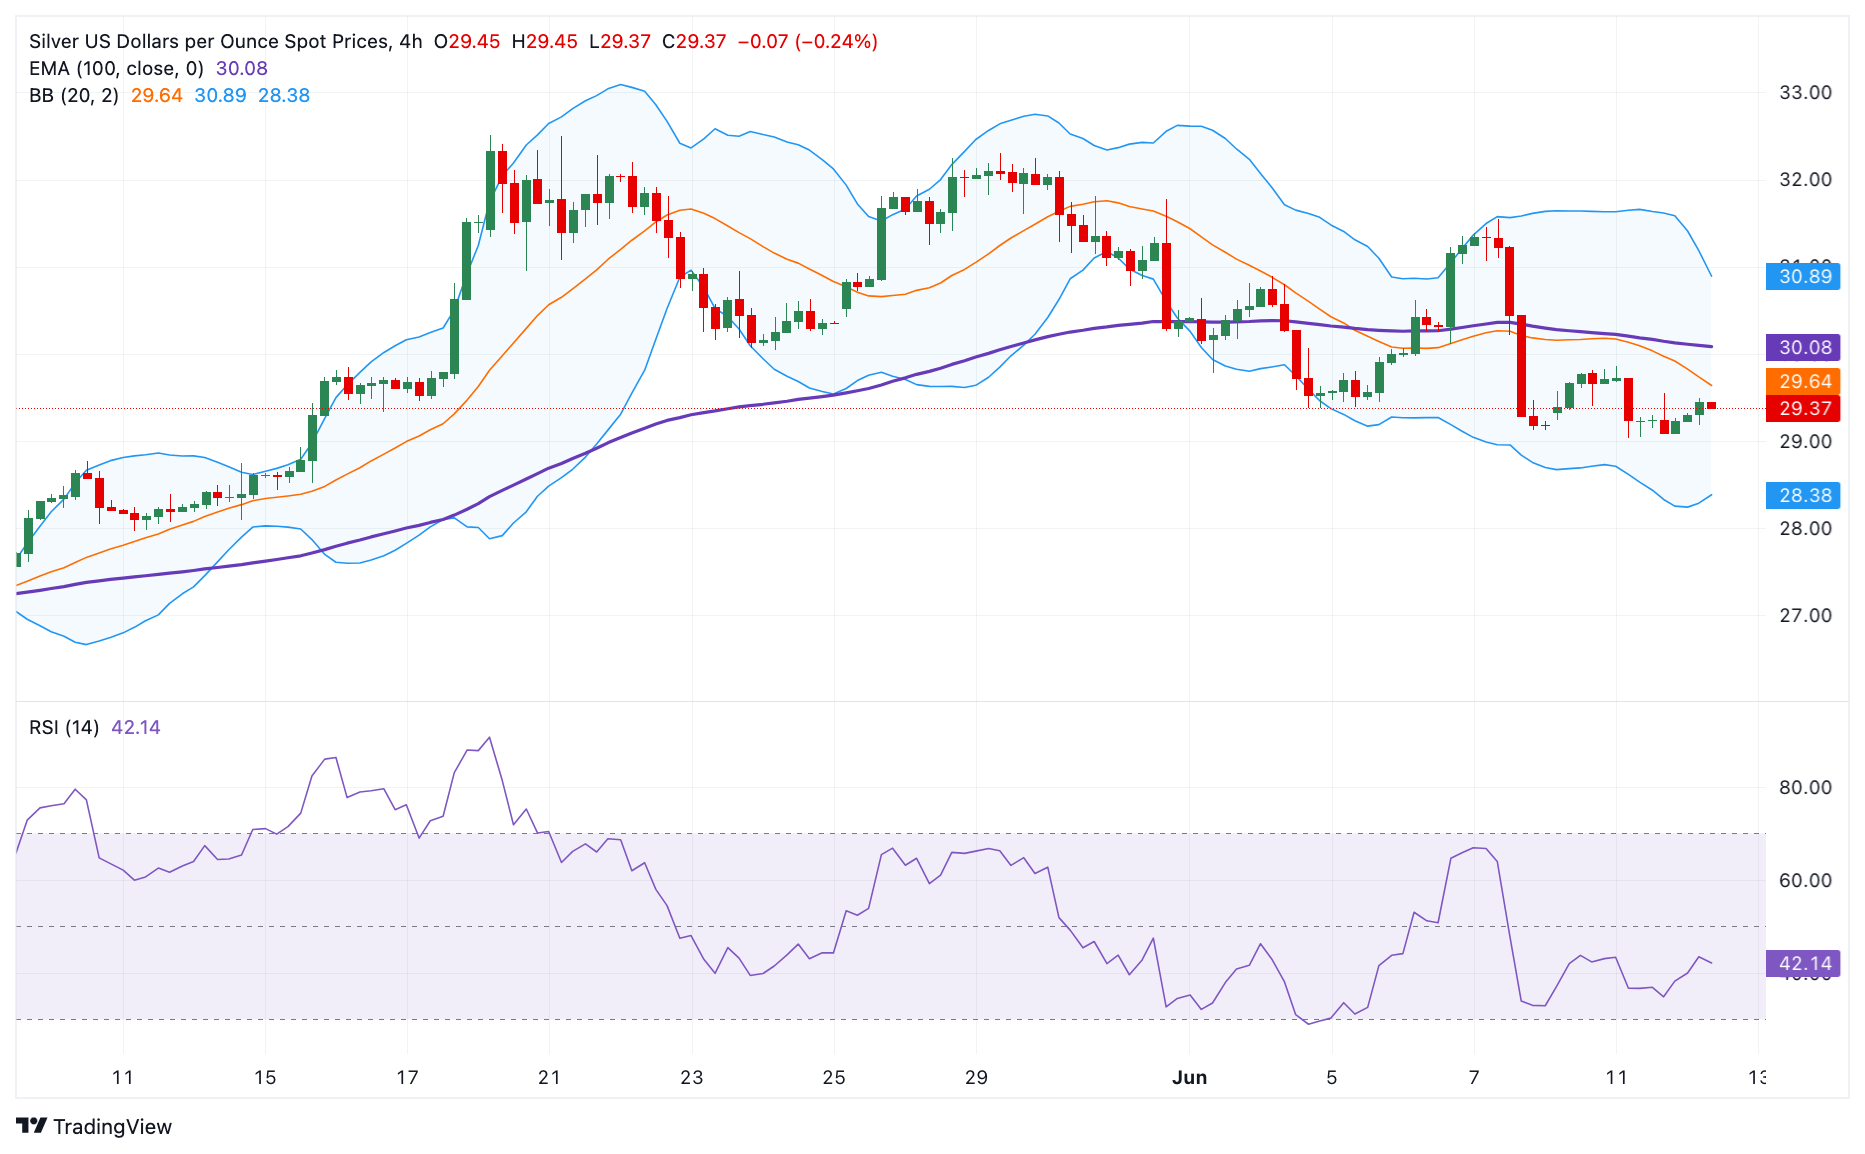
  • The negative stance of Silver remains intact below the 100-period EMA, with a bearish RSI indicator. 
  • The crucial resistance level is seen at the $30.0 psychological mark; the initial support level is located at $29.04. 

The Silver price (XAG/USD) recovers to $29.40 on Wednesday despite the stronger Greenback. However, the upside for white metal might be limited by the speculation of delayed rate cuts by the US Federal Reserve (Fed). The market could turn cautious later in the day ahead of the release of the US Consumer Price Index (CPI) and the Fed interest rate decision. 

Technically, Silver keeps the bearish vibe unchanged on the 4-hour chart as the white metal holds below the key 100-period Exponential Moving Average (EMA). Furthermore, the downward momentum is supported by the Relative Strength Index (RSI), which stands in the bearish zone near 43.0, suggesting the path of least resistance is to the downside. 

The key upside barrier for silver will emerge at $30.0, the psychological mark and 100-period EMA. A decisive break above the latter will see a rally to $30.90, the upper boundary of the Bollinger Band. The additional upside filter to watch is a high of June 7 at $31.55, and finally a high of May 29 at $32.31. 

On the flip side, a low of June 11 at $29.04 acts as an initial support level for XAG/USD. Any follow-through selling below this level will see a drop to the lower limit of the Bollinger Band at $28.40. Further south, the next contention level is located at the $28.00 round figure.  

Silver (XAG/USD) 4-hour chart

XAG/USD

Overview
Today last price29.4
Today Daily Change0.12
Today Daily Change %0.41
Today daily open29.28
 
Trends
Daily SMA2030.65
Daily SMA5028.84
Daily SMA10026.2
Daily SMA20024.69
 
Levels
Previous Daily High29.86
Previous Daily Low29.04
Previous Weekly High31.55
Previous Weekly Low29.12
Previous Monthly High32.51
Previous Monthly Low26.02
Daily Fibonacci 38.2%29.35
Daily Fibonacci 61.8%29.55
Daily Pivot Point S128.92
Daily Pivot Point S228.56
Daily Pivot Point S328.09
Daily Pivot Point R129.75
Daily Pivot Point R230.22
Daily Pivot Point R330.58

Author

Lallalit Srijandorn

Lallalit Srijandorn is a Parisian at heart. She has lived in France since 2019 and now becomes a digital entrepreneur based in Paris and Bangkok.

More from Lallalit Srijandorn
Share:

Editor's Picks

AUD/USD eyes 0.7150 barrier nine-day EMA

AUD/USD inches higher after registering modest losses in the previous day, trading around 0.7130 during the Asian hours. The technical analysis of the daily chart indicates that the pair is moving sideways within the rectangle pattern, suggesting a consolidation as neither the bulls nor the bears have enough momentum to take control of the market.

USD/JPY trades below 160.00 intervention threshold; bullish bias intact

The USD/JPY pair attracts some sellers during the Asian session amid fears that authorities will step in again to prop up the Japanese Yen. Furthermore, the Israel-Lebanon truce prompts some profit-taking around the US Dollar and exerts downward pressure on the currency pair.

Gold puts its 200-day SMA to the test near $4,420

Gold keeps the bullish stance in place in the latter part of Thursday’s session, although a convincing break above the key $4,500 mark per troy ounce still remains elusive. The precious metal’s advance comes amid the resurgence of some selling interest around the Greenback, improving risk sentiment, and declining US Treasury yields across the board.

Bitcoin’s massive storm is back: Why the sell-off is far from over

Bitcoin price action over the last few weeks has felt less like a normal, healthy correction and more like a slow grinding crash that continues to wreak havoc on holdings and trading accounts. And everything suggests that the dramatic crash isn’t over.

Nonfarm payrolls: Testing the limits of Fed policy patience

The upcoming nonfarm payrolls report for May will provide the final update on the US labor market before Kevin Warsh attends his first policy meeting as the new Fed Chair later this month.

Recession on paper: What really moves the Canadian Loonie now?

Statistics Canada handed the headline writers a gift and the analysts a headache. Real GDP shrank 0.1% on an annualized basis in the first quarter, and with the fourth quarter of 2025 revised down to a 1.0% contraction, that is two negative quarters in a row, the textbook definition of a technical recession and Canada's first since the pandemic.