|

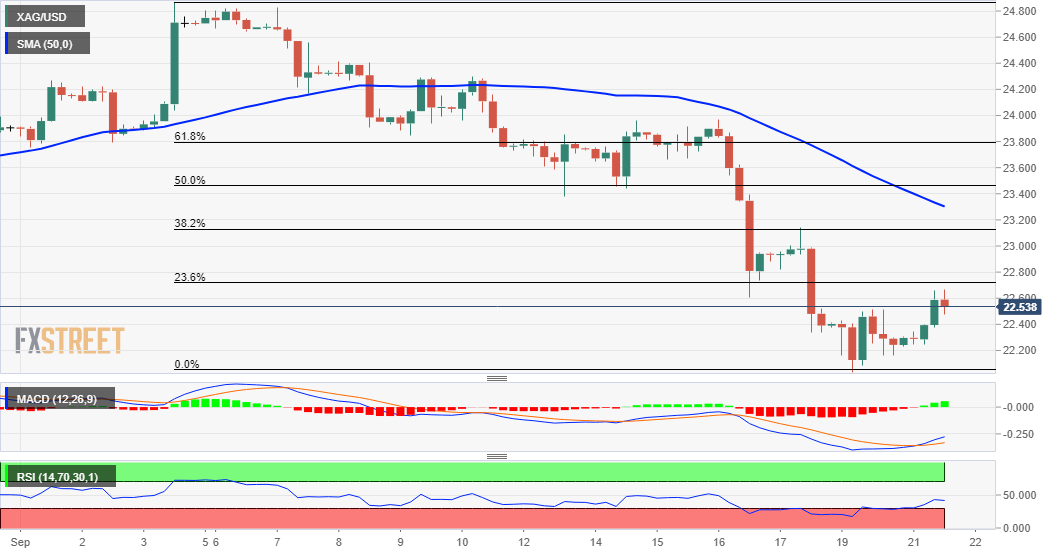
Silver Price Analysis: XAG/USD tests 23.6% Fibo. level, around $22.65-70 area

  • Silver built on its goodish recovery move from the $22.00 mark, or YTD lows touched on Monday.
  • Mixed oscillators on hourly/daily charts warrant some caution before placing fresh bullish bets.

Silver gained some positive traction on Tuesday and moved away from the lowest level since November 2020, around the $22.00 mark touched in the previous day. The commodity, for now, seems to have snapped three consecutive days of the losing streak and was last seen trading around the $22.60-65 region, up over 1.50% for the day.

The mentioned area lies just ahead of the 23.6% Fibonacci level of the $24.87-$22.04 recent leg down. Some follow-through selling will be seen as a fresh trigger for bullish traders and set the stage for additional gains. The outlook is reinforced by the fact that technical indicators on hourly charts have been gaining positive traction.

That said, oscillators on the daily chart are still holding deep in the bearish territory and warrant some caution for bullish traders. Hence, any subsequent move up might still be seen as a selling opportunity and runs the risk of fizzling out quickly near the $23.00 mark. This is closely followed by the 38.2% Fibo. level, near the $23.10 region.

On the flip side, the $22.25 area now seems to protect the immediate downside ahead of YTD lows, around the $22.00 mark. A convincing break below will be seen as a fresh trigger for bearish traders and turn the XAG/USD vulnerable. The commodity might then accelerate the fall further towards testing September 2020 swing lows, around the $21.65 region.

Silver 4-hour chart

fxsoriginal

Technical levels to watch

XAG/USD

Overview
Today last price22.63
Today Daily Change0.36
Today Daily Change %1.62
Today daily open22.27
 
Trends
Daily SMA2023.79
Daily SMA5024.32
Daily SMA10025.68
Daily SMA20025.86
 
Levels
Previous Daily High22.52
Previous Daily Low22.04
Previous Weekly High23.97
Previous Weekly Low22.33
Previous Monthly High26
Previous Monthly Low22.17
Daily Fibonacci 38.2%22.22
Daily Fibonacci 61.8%22.33
Daily Pivot Point S122.03
Daily Pivot Point S221.79
Daily Pivot Point S321.55
Daily Pivot Point R122.51
Daily Pivot Point R222.76
Daily Pivot Point R323

Author

Haresh Menghani

Haresh Menghani is a detail-oriented professional with 10+ years of extensive experience in analysing the global financial markets.

More from Haresh Menghani
Share:

Editor's Picks

EUR/USD clings to humble gains around 1.1780

EUR/USD manages to reverse Tuesday’s pullback, sticking to daily gains around 1.1780 following an earlier bull run past 1.1800 the figure. The pair’s slight advance comes on the back of the equally marginal uptick in the US Dollar, as investors continue to closely follow developments on the trade front and news from the White House.

GBP/USD flirts with weekly tops north of 1.3500

GBP/USD leaves behind the previous day’s decline and regains fresh upside traction on Wednesday, surpassing the 1.3500 barrier in a context of a marginal advance in the Greenback and a generalised improved mood in the risk-associated universe. Meanwhile, the US tariff narrative continues to dictate the mood among market participants.

Gold picks up pace, focus on $5,200

Gold buyers are stepping back in on Wednesday, with sights set on $5,200 and potentially higher, after Tuesday’s pullback from monthly highs. The yellow metal’s recovery follows some loss of momentum in the US Dollar after Trump’s SOTU speech failed to deliver fresh impetus and AI-related jitters continue to fade.

Bitcoin, Ethereum and Ripple post cautious recovery amid downside risks

Bitcoin, Ethereum, and Ripple are posting a cautious recovery on Wednesday following a market correction earlier this week.  BTC is approaching a key breakdown level, while ETH and XRP are rebounding from crucial support levels.

Nvidia remains at the heart of the AI boom

Nvidia remains at the heart of the AI boom, with Q4 revenue projected near $65.6–66.1 billion, nearly 70% higher year-over-year. But investors are watching cash flow, leverage, and broader AI adoption. Growth is strong, but the AI stress isn’t over.

Cosmos Hub Price Forecast: ATOM rebounds slightly, bearish outlook remains intact

Cosmos Hub (ATOM) price rebounds, trading above $2.05 at the time of writing on Wednesday, after undergoing a sharp correction since last week. Weakening on-chain and derivatives data support a bearish outlook, while technical analysis remains unfavorable.