|

Silver Price Analysis: XAG/USD tanks as the US Dollar stages a comeback, despite poor US data

  • XAG/USD drops from around $25.40s to $24.10s as US inflation cools and the labor market eases.
  • The RSI indicator and 3-day RoC portray a bearish outlook for Silver, with the 200-DMA on sight.

Silver price plummets across the board, as data from the United States (US) showed that inflation is cooling down, while the labor market commences easing amidst US Federal Reserve (Fed) officials complaining about its tightness. US Treasury bond yields drop, but the US Dollar (USD) rises to new weekly highs, a headwind for XAG/USD prices. At the time of writing, the XAG/USD is trading at around $24.20, slides 4.50%.

XAG/USD Price Analysis: Technical outlook

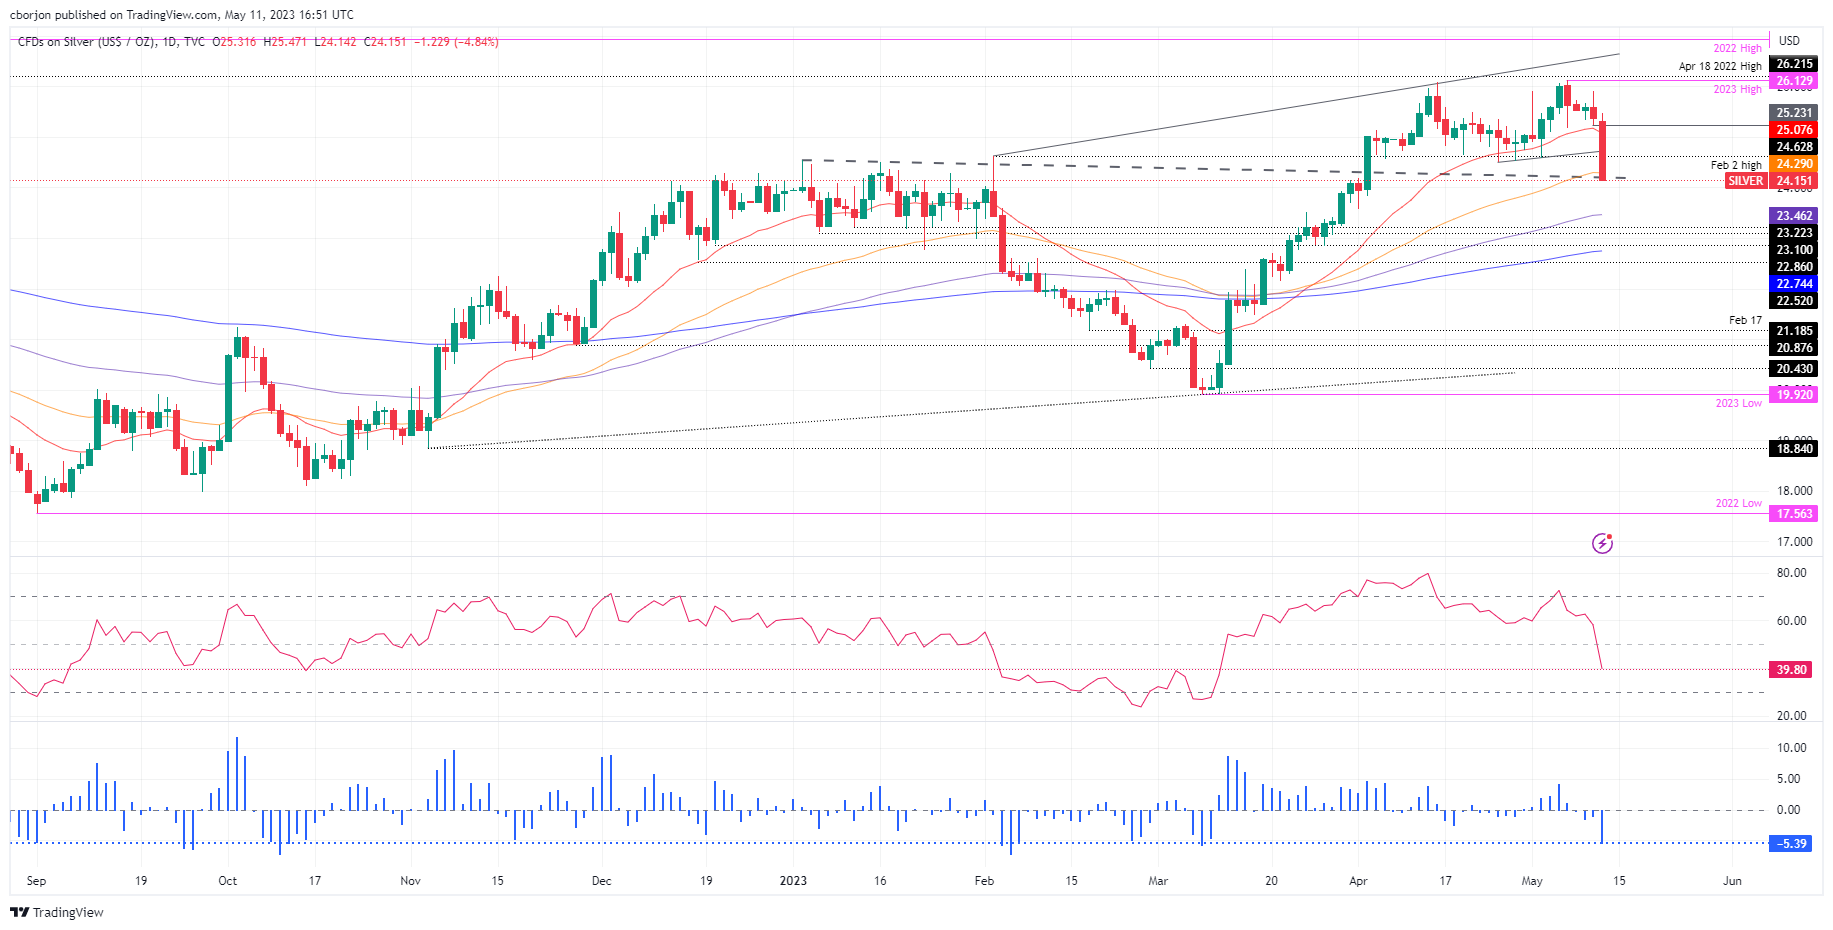
The XAG/USD collapse dragged prices into testing the 50-day Exponential Moving Average (EMA), breaking on its way south two crucial support levels: firstly, the 20-day EMA gave way around $25.08, secondly the break of the two-week support trendline at around $24.63, which, accelerated the white metal downtrend, towards testing additional key support levels.

Silver is challenging a five-month-old previous resistance trendline, turned support at around $24.20, which, once broken, the XAG/USD could drop to the $24.00 figure, followed by the 100-day EMA at $23.46. A breach of the latter will expose the 200-day EMA at $22.74.

Conversely, if XAG/USD reclaims $24.63, that could pave the way toward $25.00 a troy ounce. That would form a bullish hammer, shifting Silver’s bias to the upside, and it might open the door to test the year-to-date (YTD) high of $26.13.

The Relative Strength Index (RSI) indicator turned bearish after crossing the 50-midline. The 3-day Rate of Change (RoC) portrays sellers in charge as the XAG/USD extends its slide throughout the day.

XAG/USD Price Action – Daily Chart

XAG/USD Daily chart

XAG/USD

Overview
Today last price24.18
Today Daily Change-1.21
Today Daily Change %-4.77
Today daily open25.39
 
Trends
Daily SMA2025.32
Daily SMA5023.75
Daily SMA10023.39
Daily SMA20021.81
 
Levels
Previous Daily High25.92
Previous Daily Low25.22
Previous Weekly High26.14
Previous Weekly Low24.58
Previous Monthly High26.09
Previous Monthly Low23.57
Daily Fibonacci 38.2%25.49
Daily Fibonacci 61.8%25.66
Daily Pivot Point S125.1
Daily Pivot Point S224.81
Daily Pivot Point S324.4
Daily Pivot Point R125.8
Daily Pivot Point R226.21
Daily Pivot Point R326.5

Author

Christian Borjon Valencia

Christian Borjon began his career as a retail trader in 2010, mainly focused on technical analysis and strategies around it. He started as a swing trader, as he used to work in another industry unrelated to the financial markets.

More from Christian Borjon Valencia
Share:

Markets move fast. We move first.

Orange Juice Newsletter brings you expert driven insights - not headlines. Every day on your inbox.

By subscribing you agree to our Terms and conditions.

Editor's Picks

EUR/USD recovers to 1.1750 region as 2025 draws to a close

Following the bearish action seen in the European session on Wednesday, EUR/USD regains its traction and recovery to the 1.1750 region. Nevertheless, the pair's volatility remains low as trading conditions thin out on the last day of the year.

GBP/USD stays weak near 1.3450 on modest USD recovery

GBP/USD remains under modest beairsh pressure and fluctuates at around 1.3450 on Wednesday. The US Dollar finds fresh demand due to the end-of-the-year position adjustments, weighing on the pair amid the pre-New Year trading lull. 

Gold retreats to $4,300 area, looks to post monthly gains

Gold stays on the back foot on the last day of 2025 and trades near $4,300, possibly pressured by profit-taking and position adjustments. Nevertheless, XAU/USD remains on track to post gains for December and extend its winning streak into a fifth consecutive month.

Bitcoin, Ethereum and XRP prepare for a potential New Year rebound

Bitcoin, Ethereum, and Ripple are holding steady on Wednesday after recording minor gains on the previous day. Technically, Bitcoin could extend gains within a triangle pattern while Ethereum and Ripple face critical overhead resistance. 

Economic outlook 2026-2027 in advanced countries: Solidity test

After a year marked by global economic resilience and ending on a note of optimism, 2026 looks promising and could be a year of solid economic performance. In our baseline scenario, we expect most of the supportive factors at work in 2025 to continue to play a role in 2026.

Crypto market outlook for 2026

Year 2025 was volatile, as crypto often is.  Among positive catalysts were favourable regulatory changes in the U.S., rise of Digital Asset Treasuries (DAT), adoption of AI and tokenization of Real-World-Assets (RWA).