Silver Price Analysis: XAG/USD remains trapped between two key averages
- Silver attempts a recovery but awaits fresh impetus for the next direction.
- XAG/USD wavers between 50 and 21-day SMAs.
- Daily RSI stays flat at midline, suggesting a lack of clear direction.


Silver (XAG/USD) reverses half the Friday slide, although remains below the $27 mark, as the bulls seem to lack follow-through upside bias.
The bears are fighting hard to regain control after last week’s $2 sell-off from $28.20 levels, with no clear direction in sight, as the tug-of-war looks to extend in the session ahead.
Silver Price Chart: Daily
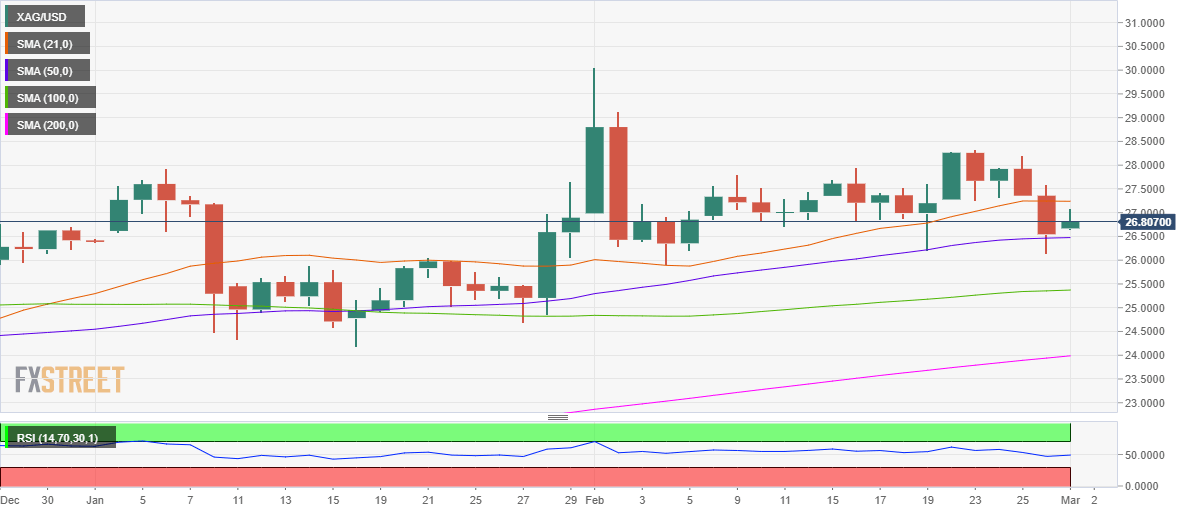
The white metal has managed to recapture the critical 50-day simple moving average (SMA) at $26.47 but the recovery remains capped below the 21-day SMA at $27. 24.
The XAG bulls need a firm break above the 21-day SMA barrier to extend the recovery from three-week troughs of $26.14 reached last Friday.
The next critical barrier is aligned at the psychological $27.50 mark.
Alternatively, should the 50-day SMA cushion give way once again, the multi-week lows could be retested.
Further south, the 100-day SMA support at $25.37 could come into play.
The 14-day Relative Strength Index (RSI) trades at the midline, suggesting a lack of clear directional bias,
Silver Additional levels
Author
Dhwani Mehta
FXStreet
Residing in Mumbai (India), Dhwani is a Senior Analyst and Manager of the Asian session at FXStreet. She has over 10 years of experience in analyzing and covering the global financial markets, with specialization in Forex and commodities markets.

















