Silver Price Analysis: XAG/USD plummets to three-week low, bears flirt with $22.00 mark


  • Silver witnessed aggressive selling on Thursday and dived to a near three-week low.
  • The technical set-up supports prospects for a further near-term depreciating move.
  • A sustained strength above the $22.00 mark is needed to negate the negative bias.

Silver dived to a near three-week low heading into the North American session, with bears now awaiting a sustained break below the $22.00 round-figure mark.

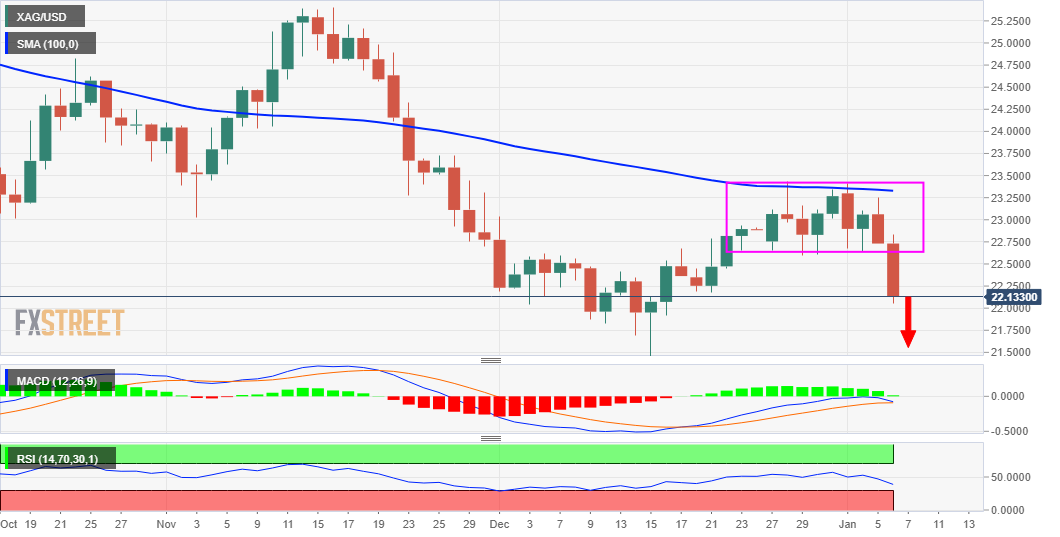
From a technical perspective, Thursday's steep decline confirmed a bearish break through the $22.65-60 region, support marked by the lower end of a one-and-half-week-old trading range. This comes on the back of the recent failures near the 100-day SMA and favours bearish traders.

Meanwhile, technical indicators on the daily chart have been gaining negative traction and are still far away from being in the oversold territory. This further adds credence to the near-term bearish outlook and supports prospects for an extension of the downward trajectory.

Some follow-through selling below the $22.00-$21.90 area will reaffirm the negative bias and drag the XAG/USD back to challenge the 2021 low, around the $21.40 region. The bearish trend could further get extended towards the next relevant support near the $21.00 round figure.

On the flip side, any attempted recovery move could now be seen as a selling opportunity around the $21.60-65 support breakpoint. This, in turn, should cap the upside for the XAG/USD near the $22.00 mark, which should act as a pivotal point for short-term traders.

Silver daily chart

fxsoriginal

Technical levels to watch

XAG/USD

Overview
Today last price 22.14
Today Daily Change -0.59
Today Daily Change % -2.60
Today daily open 22.73
 
Trends
Daily SMA20 22.63
Daily SMA50 23.32
Daily SMA100 23.34
Daily SMA200 24.74
 
Levels
Previous Daily High 23.26
Previous Daily Low 22.73
Previous Weekly High 23.44
Previous Weekly Low 22.59
Previous Monthly High 23.44
Previous Monthly Low 21.42
Daily Fibonacci 38.2% 22.93
Daily Fibonacci 61.8% 23.06
Daily Pivot Point S1 22.56
Daily Pivot Point S2 22.38
Daily Pivot Point S3 22.03
Daily Pivot Point R1 23.08
Daily Pivot Point R2 23.43
Daily Pivot Point R3 23.61


Share: Feed news

Information on these pages contains forward-looking statements that involve risks and uncertainties. Markets and instruments profiled on this page are for informational purposes only and should not in any way come across as a recommendation to buy or sell in these assets. You should do your own thorough research before making any investment decisions. FXStreet does not in any way guarantee that this information is free from mistakes, errors, or material misstatements. It also does not guarantee that this information is of a timely nature. Investing in Open Markets involves a great deal of risk, including the loss of all or a portion of your investment, as well as emotional distress. All risks, losses and costs associated with investing, including total loss of principal, are your responsibility. The views and opinions expressed in this article are those of the authors and do not necessarily reflect the official policy or position of FXStreet nor its advertisers. The author will not be held responsible for information that is found at the end of links posted on this page.

If not otherwise explicitly mentioned in the body of the article, at the time of writing, the author has no position in any stock mentioned in this article and no business relationship with any company mentioned. The author has not received compensation for writing this article, other than from FXStreet.

FXStreet and the author do not provide personalized recommendations. The author makes no representations as to the accuracy, completeness, or suitability of this information. FXStreet and the author will not be liable for any errors, omissions or any losses, injuries or damages arising from this information and its display or use. Errors and omissions excepted.

The author and FXStreet are not registered investment advisors and nothing in this article is intended to be investment advice.

Recommended content


Recommended content

Editors’ Picks

EUR/USD alternates gains with losses near 1.0720 post-US PCE

EUR/USD alternates gains with losses near 1.0720 post-US PCE

The bullish tone in the Greenback motivates EUR/USD to maintain its daily range in the low 1.070s in the wake of firmer-than-estimated US inflation data measured by the PCE.

EUR/USD News

GBP/USD clings to gains just above 1.2500 on US PCE

GBP/USD clings to gains just above 1.2500 on US PCE

GBP/USD keeps its uptrend unchanged and navigates the area beyond 1.2500 the figure amidst slight gains in the US Dollar following the release of US inflation tracked by the PCE.

GBP/USD News

Gold keeps its daily gains near $2,350 following US inflation

Gold keeps its daily gains near $2,350 following US inflation

Gold prices maintain their constructive bias around $2,350 after US inflation data gauged by the PCE surpassed consensus in March and US yields trade with slight losses following recent peaks.

Gold News

Bitcoin Weekly Forecast: BTC’s next breakout could propel it to $80,000 Premium

Bitcoin Weekly Forecast: BTC’s next breakout could propel it to $80,000

Bitcoin’s recent price consolidation could be nearing its end as technical indicators and on-chain metrics suggest a potential upward breakout. However, this move would not be straightforward and could punish impatient investors. 

Read more

Week ahead – Hawkish risk as Fed and NFP on tap, Eurozone data eyed too

Week ahead – Hawkish risk as Fed and NFP on tap, Eurozone data eyed too

Fed meets on Wednesday as US inflation stays elevated. Will Friday’s jobs report bring relief or more angst for the markets? Eurozone flash GDP and CPI numbers in focus for the Euro.

Read more

Forex MAJORS

Cryptocurrencies

Signatures