|

Silver Price Analysis: XAG/USD jumps to near three-week high, around $22.65-70 region

  • Silver gained some positive traction and shot to a near three-week high on Tuesday.
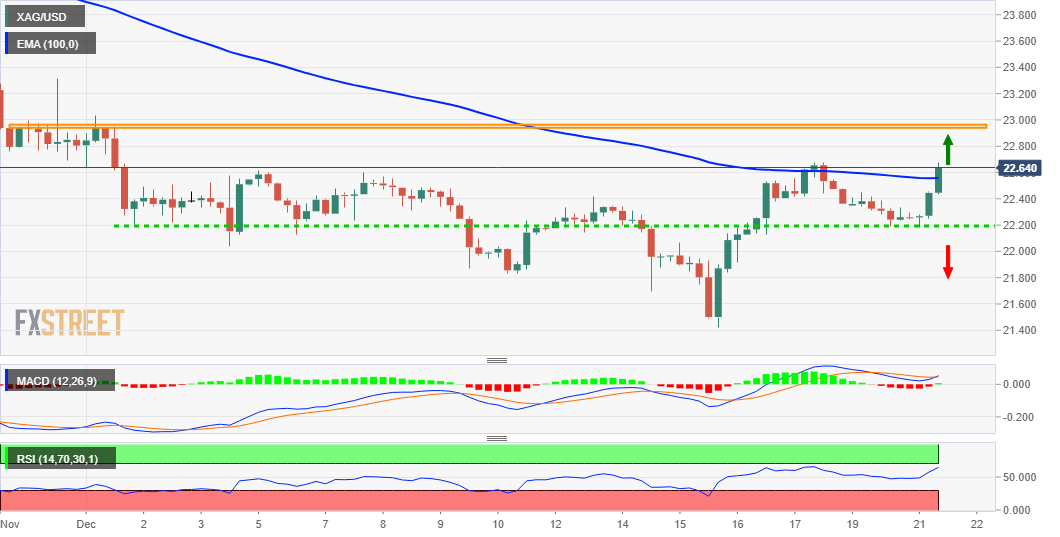
  • Strength beyond 100-period EMA on H4 supports prospects for additional gains.
  • Bearish oscillators on the daily chart warrant some caution for aggressive traders.

Silver regained positive traction on Tuesday and snapped two successive days of the losing streak. The momentum pushed spot prices to a nearly three-week high, around the $22.65-70 region during the first half of the European session.

Bulls are now be looking to build on the momentum beyond the 100-period EMA on the 4-hour chart and extend the recent bounce from the YTD low, around the $21.40 area touched last week. That said, mixed technical indicators on hourly/daily charts warrant some caution.

Oscillators on the daily chart – though have been recovering from lower levels – are still holding in the bearish territory, while RSI on the 1-hour chart is already flashing overbought conditions. Nevertheless, the intraday set-up supports prospects for further gains.

From current levels, any subsequent move up is likely to confront stiff resistance near the $22.80-85 area. Some follow-through buying, leading to a move beyond the $23.00 mark could push the XAG/USD towards the next relevant hurdle near the $23.30-35 region.

On the flip side, the $22.20-15 area now seems to protect the immediate downside ahead of the $22.00 round-figure mark. A further decline would negate the positive bias and turn the XAG/USD vulnerable to slide back to restest YTD lows support, around the $21.40 region.

Silver 4-hour chart

fxsoriginal

Technical levels to watch

XAG/USD

Overview
Today last price22.67
Today Daily Change0.42
Today Daily Change %1.89
Today daily open22.25
 
Trends
Daily SMA2022.58
Daily SMA5023.52
Daily SMA10023.48
Daily SMA20024.89
 
Levels
Previous Daily High22.45
Previous Daily Low22.19
Previous Weekly High22.68
Previous Weekly Low21.42
Previous Monthly High25.41
Previous Monthly Low22.69
Daily Fibonacci 38.2%22.29
Daily Fibonacci 61.8%22.35
Daily Pivot Point S122.15
Daily Pivot Point S222.04
Daily Pivot Point S321.89
Daily Pivot Point R122.4
Daily Pivot Point R222.55
Daily Pivot Point R322.66

Author

Haresh Menghani

Haresh Menghani is a detail-oriented professional with 10+ years of extensive experience in analysing the global financial markets.

More from Haresh Menghani
Share:

Markets move fast. We move first.

Orange Juice Newsletter brings you expert driven insights - not headlines. Every day on your inbox.

By subscribing you agree to our Terms and conditions.

Editor's Picks

EUR/USD moves sideways below 1.1800 on Christmas Eve

EUR/USD struggles to find direction and trades in a narrow channel below 1.1800 after posting gains for two consecutive days. Bond and stock markets in the US will open at the usual time and close early on Christmas Eve, allowing the trading action to remain subdued. 

GBP/USD keeps range around 1.3500 amid quiet markets

GBP/USD keeps its range trade intact at around 1.3500 on Wednesday. The Pound Sterling holds the upper hand over the US Dollar amid pre-Christmas light trading as traders move to the sidelines heading into the holiday season. 

Gold retreats from record highs, trades below $4,500

Gold retreats after setting a new record-high above $4,520 earlier in the day and trades in a tight range below $4,500 as trading volumes thin out ahead of the Christmas break. The US Dollar selling bias remains unabated on the back of dovish Fed expectations, which continues to act as a tailwind for the bullion amid persistent geopolitical risks.

Bitcoin slips below $87,000 as ETF outflows intensify, whale participation declines

Bitcoin price continues to trade around $86,770 on Wednesday, after failing to break above the $90,000 resistance. US-listed spot ETFs record an outflow of $188.64 million on Tuesday, marking the fourth consecutive day of withdrawals.

Economic outlook 2026-2027 in advanced countries: Solidity test

After a year marked by global economic resilience and ending on a note of optimism, 2026 looks promising and could be a year of solid economic performance. In our baseline scenario, we expect most of the supportive factors at work in 2025 to continue to play a role in 2026.

Avalanche struggles near $12 as Grayscale files updated form for ETF

Avalanche trades close to $12 by press time on Wednesday, extending the nearly 2% drop from the previous day. Grayscale filed an updated form to convert its Avalanche-focused Trust into an ETF with the US Securities and Exchange Commission.