|

Silver Price Analysis: XAG/USD hovers around $21.70s below the 200-DMA

  • XAG/USD clings to Wednesday’s gains of 0.36%, despite overall US Dollar strength.
  • Silver dropped below the 200-day EMAs after reaching a daily high of $22.37.
  • XAG/USD Price Analysis: Silver remains downward biased.

Silver price retraced some of its earlier gains after hitting a daily high of $22.37; a slight improvement in market sentiment strengthened the US Dollar (USD). Therefore, the XAG/USD is trading at $21.75, above its opening price by 0.36%, below the 200-day Exponential Moving Average (EMA).

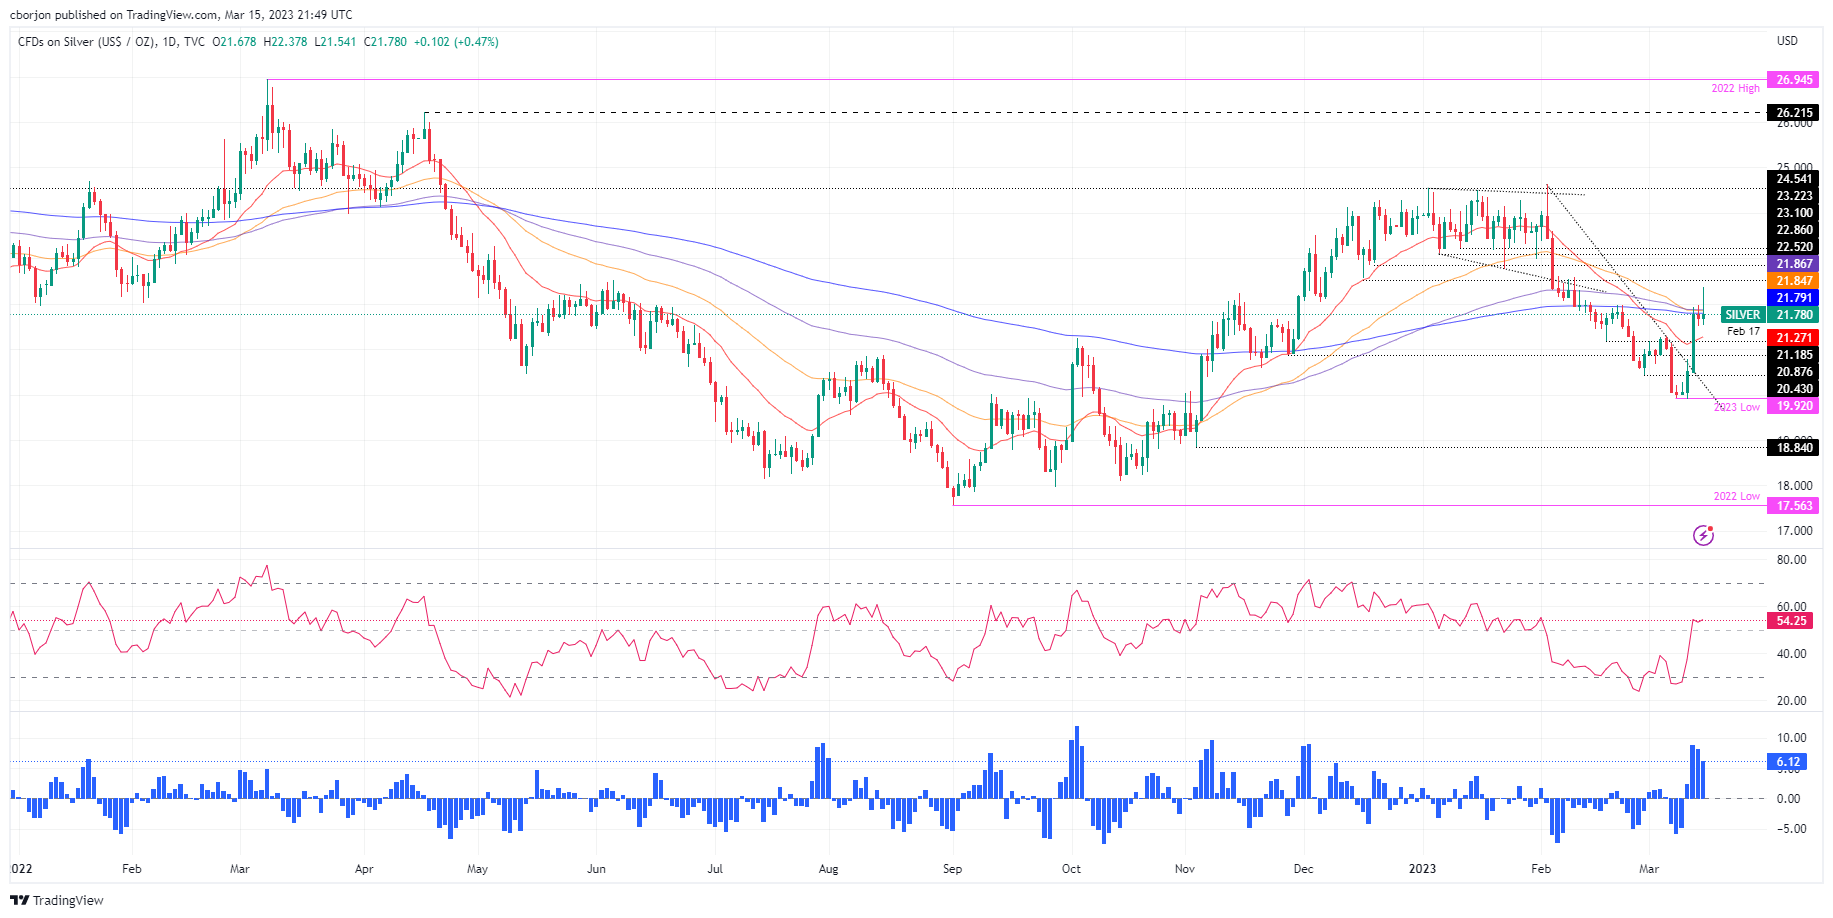
XAG/USD Price action

After reaching a daily high, the XAG/USD retreated from levels around $22.30s and cleared the confluence of the 50, 100, and 200-day EMAs at around $21.79-86. Therefore, the bearish bias remains intact, as the XAG/USD is set to achieve a daily close below the 200-day EMA.

Although oscillators shifted bullish, price action is the leading indicator. The Relative Strength Index (RSI) turned flat in bullish territory, while the Rate of Change (RoC) portrays buying pressure is waning. Therefore, the XAG/USD would remain trading sideways in the near term.

For a bearish resumption, the XAG/USD needs to crack the March 14 low of $21.50. A breach of the latter will expose the February 17 daily low at $21.18, followed by the November 28 swing low at 20.87. Once those two areas are reclaimed, the YTD low would be for grabs.

In an alternate scenario, the XAG/USD first resistance would be the confluence of the 200/100/50-day EMAs, around $21.79-86. Once buyers reclaim that area, the $22.00 figure would be up for grabs, before testing the weekly high of $22.37.

XAG/USD Daily chart

XAG/USD Technical levels

XAG/USD

Overview
Today last price21.78
Today Daily Change0.08
Today Daily Change %0.37
Today daily open21.7
 
Trends
Daily SMA2021.11
Daily SMA5022.43
Daily SMA10022.25
Daily SMA20020.94
 
Levels
Previous Daily High21.98
Previous Daily Low21.48
Previous Weekly High21.31
Previous Weekly Low19.9
Previous Monthly High24.64
Previous Monthly Low20.42
Daily Fibonacci 38.2%21.67
Daily Fibonacci 61.8%21.78
Daily Pivot Point S121.46
Daily Pivot Point S221.22
Daily Pivot Point S320.96
Daily Pivot Point R121.96
Daily Pivot Point R222.22
Daily Pivot Point R322.46

Author

Christian Borjon Valencia

Markets analyst, news editor, and trading instructor with over 14 years of experience across FX, commodities, US equity indices, and global macro markets.

More from Christian Borjon Valencia
Share:

Editor's Picks

EUR/USD slumps below 1.1800 on hawkish Fed Minutes, eyes on ECB succession

The EUR/USD pair tumbles to a near two-week low around 1.1785 during the early Asian session on Thursday. The US Dollar strengthens against the Euro on hawkish FOMC minutes that revived speculation about potential interest rate hikes if inflation remains elevated. 

GBP/USD extends decline as weak jobs data bolsters BoE rate cut bets

The Pound Sterling continued to backslide under sustained pressure on Wednesday, following through after the UK employment report on Tuesday showed a labour market deteriorating faster than expected. 

Gold consolidates the rebound below $5,000, US data eyed

Gold price consolidates the previous rebound below $5,000 in the Asian session on Thursday. The precious metal recovered on Wednesday amid shifts in geopolitical sentiment, boosting safe-haven demand. Traders will keep an eye on the release of US Initial Jobless Claims,  Pending Home Sales data, and the Fedspeak later on Thursday. 

Bitcoin approaches a critical zone: Bear pennant projects $56,000

Based on the most recent analyses from February 2026, the short answer is that it is highly unlikely that Bitcoin will reach $100,000 this month.

Mixed UK inflation data no gamechanger for the Bank of England

Food inflation plunged in January, but service sector price pressure is proving stickier. We continue to expect Bank of England rate cuts in March and June. The latest UK inflation read is a mixed bag for the Bank of England, but we doubt it drastically changes the odds of a March rate cut.

Sui extends sideways action ahead of Grayscale’s GSUI ETF launch

Sui is extending its downtrend for the second consecutive day, trading at 0.95 at the time of writing on Wednesday. The Layer-1 token is down over 16% in February and approximately 34% from the start of the year, aligning with the overall bearish sentiment across the crypto market.