- Silver remains confined in a range near the $26.00 mark, closer to over one-month lows.
- The set-up favours bearish traders and supports prospects for a further near-term decline.
- A convincing break through a short-term ascending trend-line will reaffirm the bearish bias.
Silver (XAG/USD) lacked any firm directional bias on Thursday and seesawed between tepid gains/minor losses, around the $26.00 mark through the early European session.
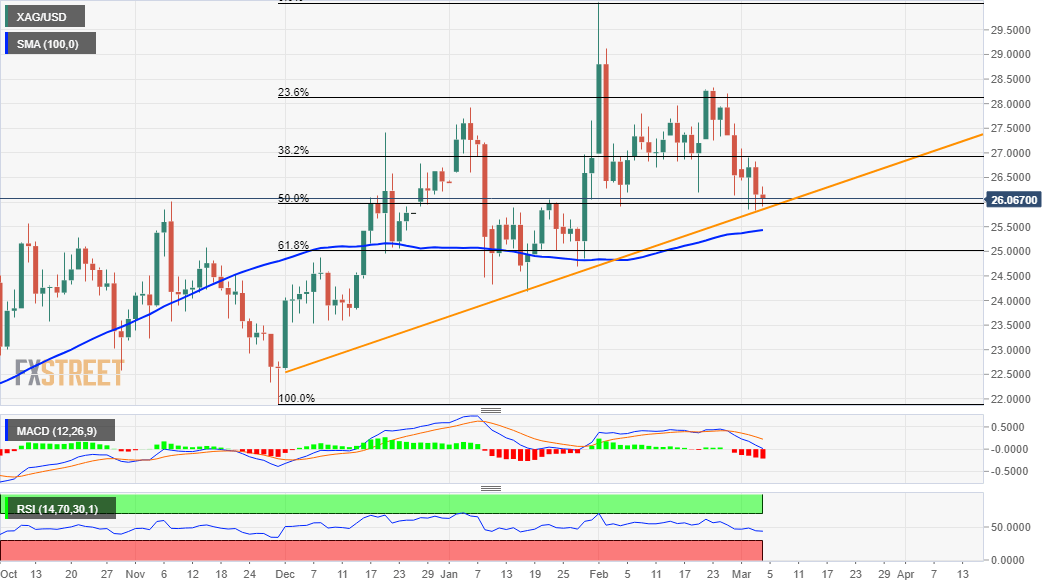
The white metal, so far, has managed to hold above the multi-week lows touched in the previous day and showed some resilience below a short-term ascending trend-line. The mentioned trend-line extends from November 2020 swing lows, or sub-$22.00 levels, which if broken decisively will be seen as a fresh trigger for bearish traders.
Given that the XAG/USD this week failed to find acceptance above the $27.00 mark, the subsequent selling supports prospects for an eventual break through the mentioned support. The negative outlook is reinforced by the fact that technical indicators on the daily chart have just started drifting into the bearish territory.
Hence, some follow-through weakness towards intermediate support near the $24.45-40 region, en-route the key $25.00 psychological mark, remains a distinct possibility. The downward trajectory could further get extended and drag the XAG/USD towards the next relevant support around the $24.75-70 horizontal zone.
On the flip side, any attempted recovery towards the $26.30-35 region might still be seen as a selling opportunity. This is followed by the $26.75-80 supply zone, which should cap the upside for silver. That said, a sustained strength beyond, leading to a subsequent break through the $27.00 mark will negate the bearish outlook.
XAG/USD daily chart
Technical levels to watch
Information on these pages contains forward-looking statements that involve risks and uncertainties. Markets and instruments profiled on this page are for informational purposes only and should not in any way come across as a recommendation to buy or sell in these assets. You should do your own thorough research before making any investment decisions. FXStreet does not in any way guarantee that this information is free from mistakes, errors, or material misstatements. It also does not guarantee that this information is of a timely nature. Investing in Open Markets involves a great deal of risk, including the loss of all or a portion of your investment, as well as emotional distress. All risks, losses and costs associated with investing, including total loss of principal, are your responsibility. The views and opinions expressed in this article are those of the authors and do not necessarily reflect the official policy or position of FXStreet nor its advertisers. The author will not be held responsible for information that is found at the end of links posted on this page.
If not otherwise explicitly mentioned in the body of the article, at the time of writing, the author has no position in any stock mentioned in this article and no business relationship with any company mentioned. The author has not received compensation for writing this article, other than from FXStreet.
FXStreet and the author do not provide personalized recommendations. The author makes no representations as to the accuracy, completeness, or suitability of this information. FXStreet and the author will not be liable for any errors, omissions or any losses, injuries or damages arising from this information and its display or use. Errors and omissions excepted.
The author and FXStreet are not registered investment advisors and nothing in this article is intended to be investment advice.
Recommended content
Editors’ Picks
EUR/USD holds below 1.0750 ahead of key US data

EUR/USD trades in a tight range below 1.0750 in the European session on Friday. The US Dollar struggles to gather strength ahead of key PCE Price Index data, the Fed's preferred gauge of inflation, and helps the pair hold its ground.
GBP/USD consolidates above 1.2500, eyes on US PCE data

GBP/USD fluctuates at around 1.2500 in the European session on Friday following the three-day rebound. The PCE inflation data for March will be watched closely by market participants later in the day.
Gold clings to modest daily gains at around $2,350

Gold stays in positive territory at around $2,350 after closing in positive territory on Thursday. The benchmark 10-year US Treasury bond yield edges lower ahead of US PCE Price Index data, allowing XAU/USD to stretch higher.
Bitcoin Weekly Forecast: BTC’s next breakout could propel it to $80,000 Premium

Bitcoin’s recent price consolidation could be nearing its end as technical indicators and on-chain metrics suggest a potential upward breakout. However, this move would not be straightforward and could punish impatient investors.
US core PCE inflation set to signal firm price pressures as markets delay Federal Reserve rate cut bets

The core PCE Price Index, which excludes volatile food and energy prices, is seen as the more influential measure of inflation in terms of Fed positioning. The index is forecast to rise 0.3% on a monthly basis in March, matching February’s increase.