|

Silver Price Analysis: XAG/USD hits multi-week low, seems vulnerable below 50% Fibo.

  • Silver drifts lower for the fourth straight day and touches a near three-week trough.
  • The technical set-up favours bearish traders and supports prospects for further losses.
  • A sustained strength beyond the $24.00 mark is needed to negate the negative outlook.

Silver (XAG/USD) remains under some selling pressure for the fourth successive day on Wednesday and drops to a near three-week low, below mid-$23.00s during the first half of the European session.

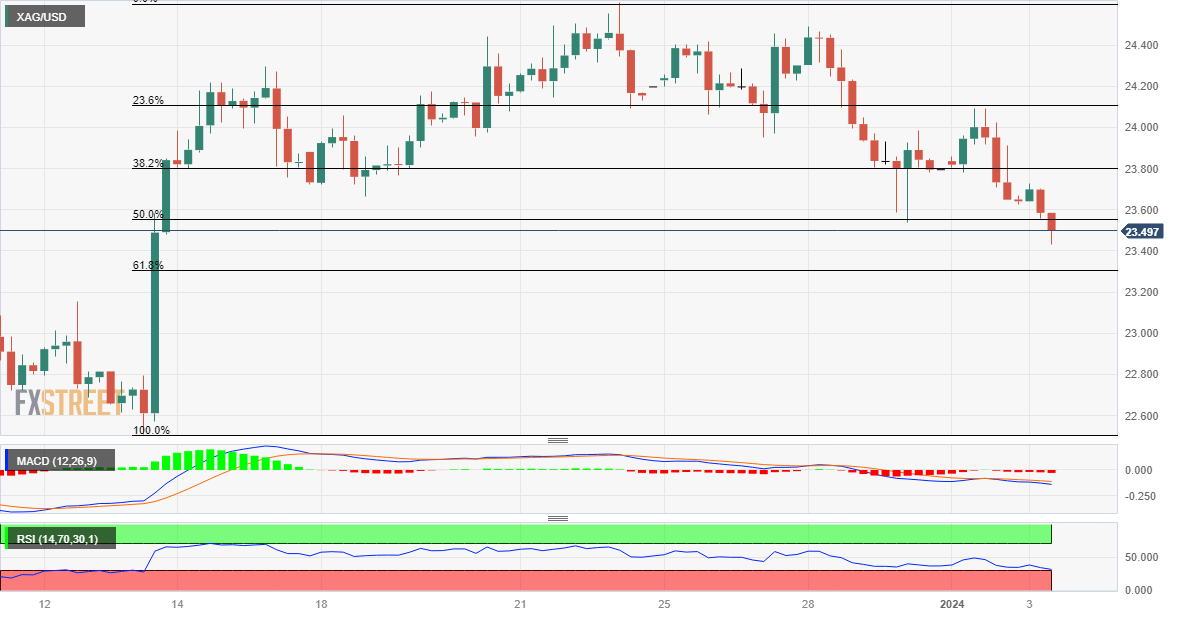
With the latest leg down, the XAG/USD confirms a breakdown through the 50% Fibonacci retracement level of the $22.51-$24.61 move up and seems vulnerable to decline further. The negative outlook is reinforced by the fact that technical indicators on the daily chart have again started gaining negative traction and are holding deep in the negative territory on hourly charts. This, in turn, suggests that the path of least resistance for the white metal is to the downside.

Any subsequent slide, however, is likely to find some support near the 61.8% Fibo. level, around the $23.30 region, ahead of the $23.15 zone, representing a multi-month-old ascending trend-line support, and the $23.00 round-figure mark. The latter should act as a key pivotal point, which if broken decisively will be seen as a fresh trigger for bearish traders and pave the way for an extension of the recent downfall witnessed over the past week or so.

The XAG/USD might then accelerate the downfall further towards the December monthly swing low, around mid-$22.00s, before dropping to the $22.25 support and the $22.00 round-figure mark.

On the flip side, recovery back above the $23.55 region (50% Fibo. level) might now be seen as a selling opportunity near the $23.75-$23.80 area, or the 38.2% Fibo. level. This is closely followed by the $24.00 mark, which if cleared decisively will suggest that the recent corrective slide has run its course and push the XAG/USD further towards the $24.60 area (December 22 high). Bulls might eventually aim to reclaim the $25.00 psychological mark.

Silver 4-hour chart

fxsoriginal

Technical levels to watch

XAG/USD

Overview
Today last price23.45
Today Daily Change-0.21
Today Daily Change %-0.89
Today daily open23.66
 
Trends
Daily SMA2023.83
Daily SMA5023.65
Daily SMA10023.3
Daily SMA20023.67
 
Levels
Previous Daily High24.09
Previous Daily Low23.64
Previous Weekly High24.49
Previous Weekly Low23.54
Previous Monthly High25.92
Previous Monthly Low22.51
Daily Fibonacci 38.2%23.82
Daily Fibonacci 61.8%23.92
Daily Pivot Point S123.5
Daily Pivot Point S223.35
Daily Pivot Point S323.05
Daily Pivot Point R123.95
Daily Pivot Point R224.25
Daily Pivot Point R324.4

(This story was corrected on January 3 at 09:55 GMT to say, in the third bullet point, that a move beyond $24.00 mark is needed to negate the negative outlook, not positive outlook.)

Author

Haresh Menghani

Haresh Menghani is a detail-oriented professional with 10+ years of extensive experience in analysing the global financial markets.

More from Haresh Menghani
Share:

Editor's Picks

AUD/USD eyes 0.7150 barrier nine-day EMA

AUD/USD inches higher after registering modest losses in the previous day, trading around 0.7130 during the Asian hours. The technical analysis of the daily chart indicates that the pair is moving sideways within the rectangle pattern, suggesting a consolidation as neither the bulls nor the bears have enough momentum to take control of the market.

USD/JPY trades below 160.00 intervention threshold; bullish bias intact

The USD/JPY pair attracts some sellers during the Asian session amid fears that authorities will step in again to prop up the Japanese Yen. Furthermore, the Israel-Lebanon truce prompts some profit-taking around the US Dollar and exerts downward pressure on the currency pair.

Gold defends 200-day SMA, rises toward $4,500

Gold is attempting a tepid recovery toward $4,500 on Thursday, as renewed optimism in the Mideast geopolitical front calms market nerves. This cautious optimism across Asian markets weighs on Oil prices, and diminishes the US Dollar’s safe-haven appeal, helping Gold stage a decent comeback from the weekly low of $4,424.


Hyperliquid: ETF demand, capital rotation fuel HYPE rally as Bitcoin melts

Hyperliquid price sustains an upward trend near its all-time high of $75.76 on Thursday after posting 80% gains in May, while Bitcoin (BTC) retraces below $65,000, triggering a market-wide panic.

Kevin Warsh takes the Fed helm: What it means for the US Dollar
The Federal Reserve moves away from the highly predictable "forward guidance" model of the Jerome Powell era to a new “Kevin Warsh environment”, characterized by less communication, more policy surprises, and an increased focus on the Fed's complex balance sheet.
Recession on paper: What really moves the Canadian Loonie now?

Statistics Canada handed the headline writers a gift and the analysts a headache. Real GDP shrank 0.1% on an annualized basis in the first quarter, and with the fourth quarter of 2025 revised down to a 1.0% contraction, that is two negative quarters in a row, the textbook definition of a technical recession and Canada's first since the pandemic.