|

Silver Price Analysis: XAG/USD gets knocked back, slips back below $22 on US CPI plunge

  • Spot Silver takes a knee after the US CPI inflation reading mangles investor risk appetite for Thursday.
  • Risk appetite has soured and Silver's meager gains for Thursday have evaporated.
  • Investors will be keeping an eye out for changes to the Fed's dot plot moving forward.

The XAG/USD slid below $21.80 on reaction to the US Consumer Price Index (CPI) inflation reading, kicking Silver prices back into the day's lows and sending bids down 2.2% from today's highs near $22.24.

US CPI inflation holds steady at 3.7% in September vs. 3.6% forecast

Investors are facing a fresh round of rate fears from the Federal Reserve (Fed), as still-high inflation that fails to wane as fast as investors hope for could see the US central bank get pushed into another rate hike before the end of 2023, and see interest rates hold "higher for longer" than markets previously estimated.

XAG/USD Technical Outlook

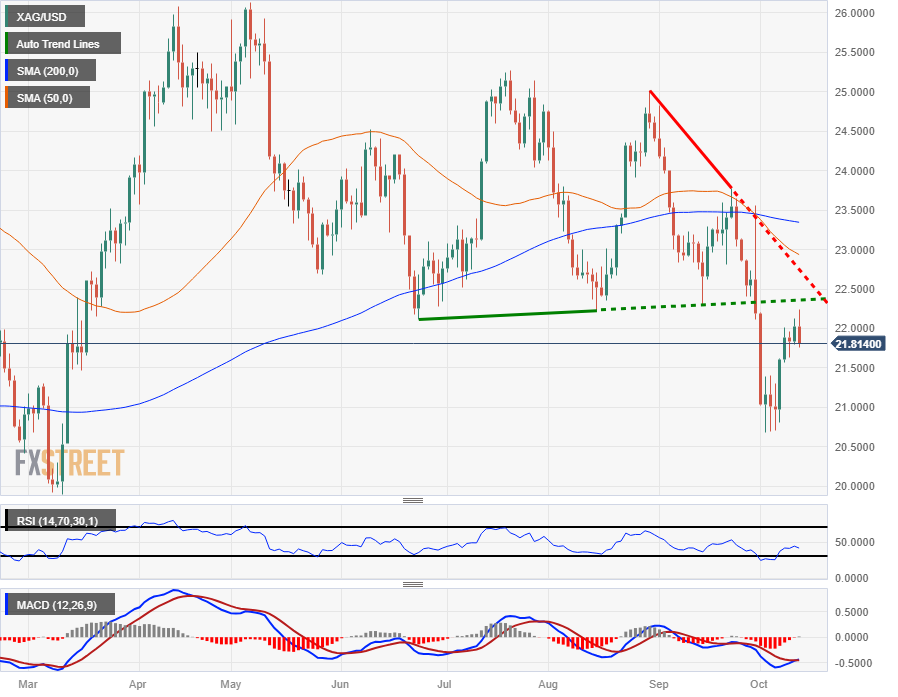
Silver spot tumbled from the $22.20 region into $21.80 on Thursday, and is heading into the 200-hour Simple Moving Average (SMA) near $21.50.

XAG/USD remains steeply off the year's highs of $26.14, and remains in the red from 2023's opening bids of $24.00. The last swing high on the daily candlesticks into $23.75 saw Silver shed the 200-day SMA and mark in a low of $20.68 for the year.

Thursday's bearish candle could see XAG/USD spark another bear run off of the descending trendline from late August's tops near $25.00.

XAG/USD Daily Chart
XAG/USD Technical Levels

XAG/USD

Overview
Today last price21.84
Today Daily Change-0.19
Today Daily Change %-0.86
Today daily open22.03
 
Trends
Daily SMA2022.36
Daily SMA5022.97
Daily SMA10023.34
Daily SMA20023.36
 
Levels
Previous Daily High22.12
Previous Daily Low21.8
Previous Weekly High22.2
Previous Weekly Low20.68
Previous Monthly High24.82
Previous Monthly Low22.12
Daily Fibonacci 38.2%22
Daily Fibonacci 61.8%21.92
Daily Pivot Point S121.85
Daily Pivot Point S221.66
Daily Pivot Point S321.52
Daily Pivot Point R122.17
Daily Pivot Point R222.31
Daily Pivot Point R322.5

Author

Joshua Gibson

Joshua joins the FXStreet team as an Economics and Finance double major from Vancouver Island University with twelve years' experience as an independent trader focusing on technical analysis.


More from Joshua Gibson
Share:

Editor's Picks

GBP/USD flirts with 1.3500 as USD finds fresh demand

GBP/USD is flatlining near the 1.3500 level in Europe on Tuesday, facing some pressure from renewed US Dollar demand as a safe-haven amid surging Oil prices and inflationary concerns. The focus now remains on the Middle East headlines, with Wednesday's US CPI data the key event risk this week.

EUR/USD stays weak near 1.1550 amid US-Iran impasse

EUR/USD struggles to gain any meaningful traction and hovers near the 1.1550 area in the European session. Traders seem hesitant to place aggressive bets and opt to wait for further developments surrounding the Middle East crisis and this week's release of the latest US inflation figures.

Gold off two-month highs, back below $4,400 amid surging Oil prices

Gold retreats from its highest level since June 5 at $4,435, touched earlier this Tuesday, and slides back below the $4,400 mark in European trading. Surging Oil prices, amid the US-Iran impasse on talks to reopen the Strait of Hormuz, rekindled inflation concerns, lending support to the US DOllar at the expense of the non-yielding bullion.

Pi Network holds at key support as broader market declines

Pi Network steadies around $0.08745 after two consecutive days of losses, capped below the $0.1000 psychological threshold. Retail demand in PI derivatives remains firm, with Open Interest above $9 million, even as broader crypto market sentiment wanes. Technically, PI faces a steeper correction, as it lacks upside momentum to support a near-term recovery.

The inflation narrative is still way more important than the employment story
Core bonds sold off yesterday with the belly of the curve slightly underperforming in the US while European curves showed more of a bear flattening. Daily changes on the US curve varied between +4.7 bps (2-yr) and +6.4 bps (7-yr).
9-3: Is the Federal Reserve’s vote tally Warsh's new forward guidance?
The rate did not move. Neither did the statement, and that’s the more interesting fact. Set the July 29 Federal Open Market Committee (FOMC) statement beside the one issued on June 17, and the two documents are identical apart from a single verb and a paragraph at the bottom naming three dissenters.














