|

Silver Price Analysis: XAG/USD defends ascending trend-line/100-period SMA confluence support

  • Silver once again managed to find decent support near the $27.45 confluence support.
  • Mixed oscillators on hourly/daily charts warrant caution before placing directional bets.

Silver attracted some dip-buying near the lower end of its weekly trading range, around the $27.45 region and refreshed daily tops during the early part of the European session.

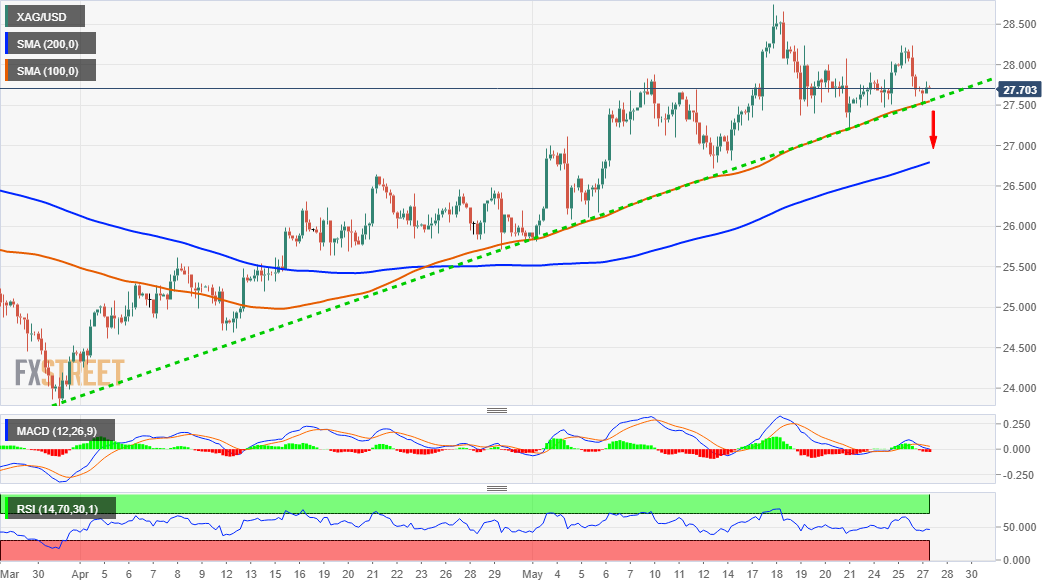
The mentioned area marks an important confluence support comprising an ascending trend-line extending from YTD lows and 100-period SMA on the 4-hour chart. This should now act as a key pivotal point for short-term traders and help determine the next leg of a directional move for the XAG/USD.

The commodity, for now, seems to have stalled its retracement slide from one-week tops, around the $28.20-25 region touched in the previous session. That said, the lack of any follow-through buying warrants some caution before traders start positioning for any further appreciating move.

Meanwhile, technical indicators on hourly charts have started drifting into the negative territory, albeit maintained their bullish bias on the daily chart. This makes it prudent to wait for sustained weakness below the said confluence support in order to confirm a near-term bearish bias.

Some follow-through selling below the last week's swing low, near the $27.20 area will reaffirm a breakdown and prompt aggressive technical selling. The XAG/USD might then turn vulnerable to break below the $27.00 mark and accelerate the slide to 200-period SMA, around the $26.75 region.

The downward trajectory could further get extended and drag the metal to the $26.25 region, en-route the $26.00 mark and the next major support near the $25.75-70 zone.

On the flip side, the $28.00 mark now seems to act as an immediate resistance ahead of the $28.20-25 supply zone. A convincing break through the mentioned hurdle should pave the way for a move beyond the $28.75 intermediate hurdle and allow bulls to aim back to reclaim the $29.00 round figure.

XAG/USD 4-hour chart

fxsoriginal

Technical levels to watch

XAG/USD

Overview
Today last price27.72
Today Daily Change0.03
Today Daily Change %0.11
Today daily open27.69
 
Trends
Daily SMA2027.3
Daily SMA5026.22
Daily SMA10026.3
Daily SMA20025.69
 
Levels
Previous Daily High28.23
Previous Daily Low27.6
Previous Weekly High28.75
Previous Weekly Low27.2
Previous Monthly High26.64
Previous Monthly Low24.25
Daily Fibonacci 38.2%27.85
Daily Fibonacci 61.8%27.99
Daily Pivot Point S127.45
Daily Pivot Point S227.21
Daily Pivot Point S326.82
Daily Pivot Point R128.08
Daily Pivot Point R228.47
Daily Pivot Point R328.71

Author

Haresh Menghani

Haresh Menghani is a detail-oriented professional with 10+ years of extensive experience in analysing the global financial markets.

More from Haresh Menghani
Share:

Markets move fast. We move first.

Orange Juice Newsletter brings you expert driven insights - not headlines. Every day on your inbox.

By subscribing you agree to our Terms and conditions.

Editor's Picks

EUR/USD moves sideways below 1.1800 on Christmas Eve

EUR/USD struggles to find direction and trades in a narrow channel below 1.1800 after posting gains for two consecutive days. Bond and stock markets in the US will open at the usual time and close early on Christmas Eve, allowing the trading action to remain subdued. 

GBP/USD keeps range around 1.3500 amid quiet markets

GBP/USD keeps its range trade intact at around 1.3500 on Wednesday. The Pound Sterling holds the upper hand over the US Dollar amid pre-Christmas light trading as traders move to the sidelines heading into the holiday season. 

Gold retreats from record highs, trades below $4,500

Gold retreats after setting a new record-high above $4,520 earlier in the day and trades in a tight range below $4,500 as trading volumes thin out ahead of the Christmas break. The US Dollar selling bias remains unabated on the back of dovish Fed expectations, which continues to act as a tailwind for the bullion amid persistent geopolitical risks.

Bitcoin slips below $87,000 as ETF outflows intensify, whale participation declines

Bitcoin price continues to trade around $86,770 on Wednesday, after failing to break above the $90,000 resistance. US-listed spot ETFs record an outflow of $188.64 million on Tuesday, marking the fourth consecutive day of withdrawals.

Economic outlook 2026-2027 in advanced countries: Solidity test

After a year marked by global economic resilience and ending on a note of optimism, 2026 looks promising and could be a year of solid economic performance. In our baseline scenario, we expect most of the supportive factors at work in 2025 to continue to play a role in 2026.

Avalanche struggles near $12 as Grayscale files updated form for ETF

Avalanche trades close to $12 by press time on Wednesday, extending the nearly 2% drop from the previous day. Grayscale filed an updated form to convert its Avalanche-focused Trust into an ETF with the US Securities and Exchange Commission.