|

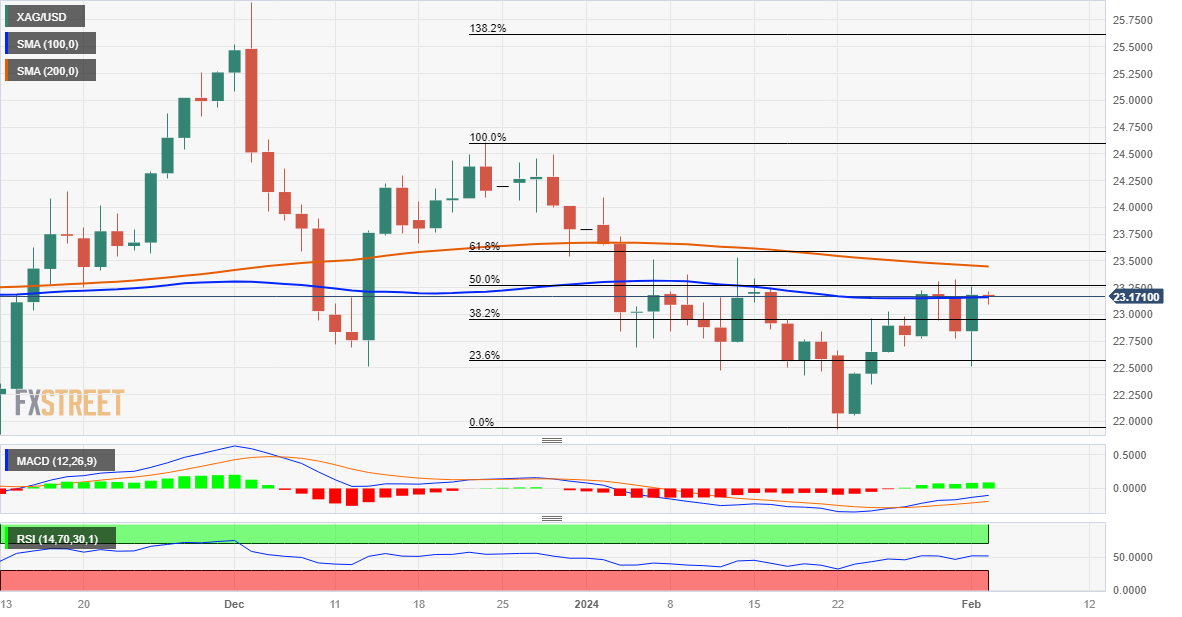
Silver Price Analysis: XAG/USD consolidates around 100-day SMA, below 50% Fibo.

  • Silver oscillates in a narrow trading band just below the 50% Fibo. level on Friday.
  • The technical setup favours bullish trades and supports prospects for further gains.
  • A convincing break below the $22.55 area is needed to negate the positive outlook.

Silver (XAG/USD) struggles to capitalize on the previous day's solid recovery from the $22.50 region, or a one-week trough and oscillates in a narrow trading band through the first half of the European session on Friday. The white metal currently trades around the $23.15 region, nearly unchanged for the day, as traders keenly await the release of the US monthly jobs report (NFP) before placing fresh directional bets.

From a technical perspective, the XAG/USD, so far, has been struggling to break through a resistance marked by the 50% Fibonacci retracement level of the late December-January downfall. This is closely followed by the very important 200-day Simple Moving Average (SMA), currently around the $23.45 region, and the 61.8% Fibo. level near the $23.55 area. A sustained strength beyond the latter will be seen as a fresh trigger for bullish traders and set the stage for an extension of the recent move up from sub-$22.00 levels, or over a two-month low touched on January 22.

Given that oscillators on the daily chart have just started gaining positive traction, the XAG/USD might then aim back towards reclaiming the $24.00 round figure. The momentum could extend towards the next relevant hurdle near the $24.50-$24.60 area and the $25.00 psychological mark. Some follow-through buying has the potential to lift the white metal to the $25.45-$25.50 intermediate barrier en route to the $26.00 neighbourhood, or the December swing high.

On the flip side, weakness back below the $23.00 mark might continue to find some support near the $22.55 area, which if broken decisively will suggest that a nearly two-week-old uptrend has run its course and shift the bias back in favour of bearish traders. The XAG/USD might then turn vulnerable to retest the $21.95-$21.90 region, or a two-month low, before eventually dropping to the $21.40-$21.35 area en route to the $21.00 mark and the $20.70-$20.65 zone, or the October swing low.

Silver daily chart

fxsoriginal

Technical levels to watch

XAG/USD

Overview
Today last price23.18
Today Daily Change0.00
Today Daily Change %0.00
Today daily open23.18
 
Trends
Daily SMA2022.86
Daily SMA5023.57
Daily SMA10023.16
Daily SMA20023.46
 
Levels
Previous Daily High23.26
Previous Daily Low22.51
Previous Weekly High23.03
Previous Weekly Low21.93
Previous Monthly High24.09
Previous Monthly Low21.93
Daily Fibonacci 38.2%22.97
Daily Fibonacci 61.8%22.8
Daily Pivot Point S122.71
Daily Pivot Point S222.24
Daily Pivot Point S321.97
Daily Pivot Point R123.46
Daily Pivot Point R223.73
Daily Pivot Point R324.2

Author

Haresh Menghani

Haresh Menghani is a detail-oriented professional with 10+ years of extensive experience in analysing the global financial markets.

More from Haresh Menghani
Share:

Markets move fast. We move first.

Orange Juice Newsletter brings you expert driven insights - not headlines. Every day on your inbox.

By subscribing you agree to our Terms and conditions.

Editor's Picks

EUR/USD moves sideways below 1.1800 on Christmas Eve

EUR/USD struggles to find direction and trades in a narrow channel below 1.1800 after posting gains for two consecutive days. Bond and stock markets in the US will open at the usual time and close early on Christmas Eve, allowing the trading action to remain subdued. 

GBP/USD keeps range around 1.3500 amid quiet markets

GBP/USD keeps its range trade intact at around 1.3500 on Wednesday. The Pound Sterling holds the upper hand over the US Dollar amid pre-Christmas light trading as traders move to the sidelines heading into the holiday season. 

Gold retreats from record highs, trades below $4,500

Gold retreats after setting a new record-high above $4,520 earlier in the day and trades in a tight range below $4,500 as trading volumes thin out ahead of the Christmas break. The US Dollar selling bias remains unabated on the back of dovish Fed expectations, which continues to act as a tailwind for the bullion amid persistent geopolitical risks.

Bitcoin slips below $87,000 as ETF outflows intensify, whale participation declines

Bitcoin price continues to trade around $86,770 on Wednesday, after failing to break above the $90,000 resistance. US-listed spot ETFs record an outflow of $188.64 million on Tuesday, marking the fourth consecutive day of withdrawals.

Economic outlook 2026-2027 in advanced countries: Solidity test

After a year marked by global economic resilience and ending on a note of optimism, 2026 looks promising and could be a year of solid economic performance. In our baseline scenario, we expect most of the supportive factors at work in 2025 to continue to play a role in 2026.

Avalanche struggles near $12 as Grayscale files updated form for ETF

Avalanche trades close to $12 by press time on Wednesday, extending the nearly 2% drop from the previous day. Grayscale filed an updated form to convert its Avalanche-focused Trust into an ETF with the US Securities and Exchange Commission.