GBP/JPY Price Forecast: Bullish engulfing pattern puts 211.00 in play
- GBP/JPY rises 0.24% despite Middle East tensions between the US and Iran.
- Bullish engulfing pattern and RSI rebound signal potential continuation higher.
- Break above 211.00 targets 212.12 and 213.82, while 210.00 guards downside.

GBP/JPY rises during the North American session on Monday, up by 0.24% after recovering from hitting daily lows of 209.10 amid risk aversion spurred by the Middle East conflict between the US and Iran. At the time of writing, the cross-pair trades at 210.98, about to overcome the 211.00 hurdle.
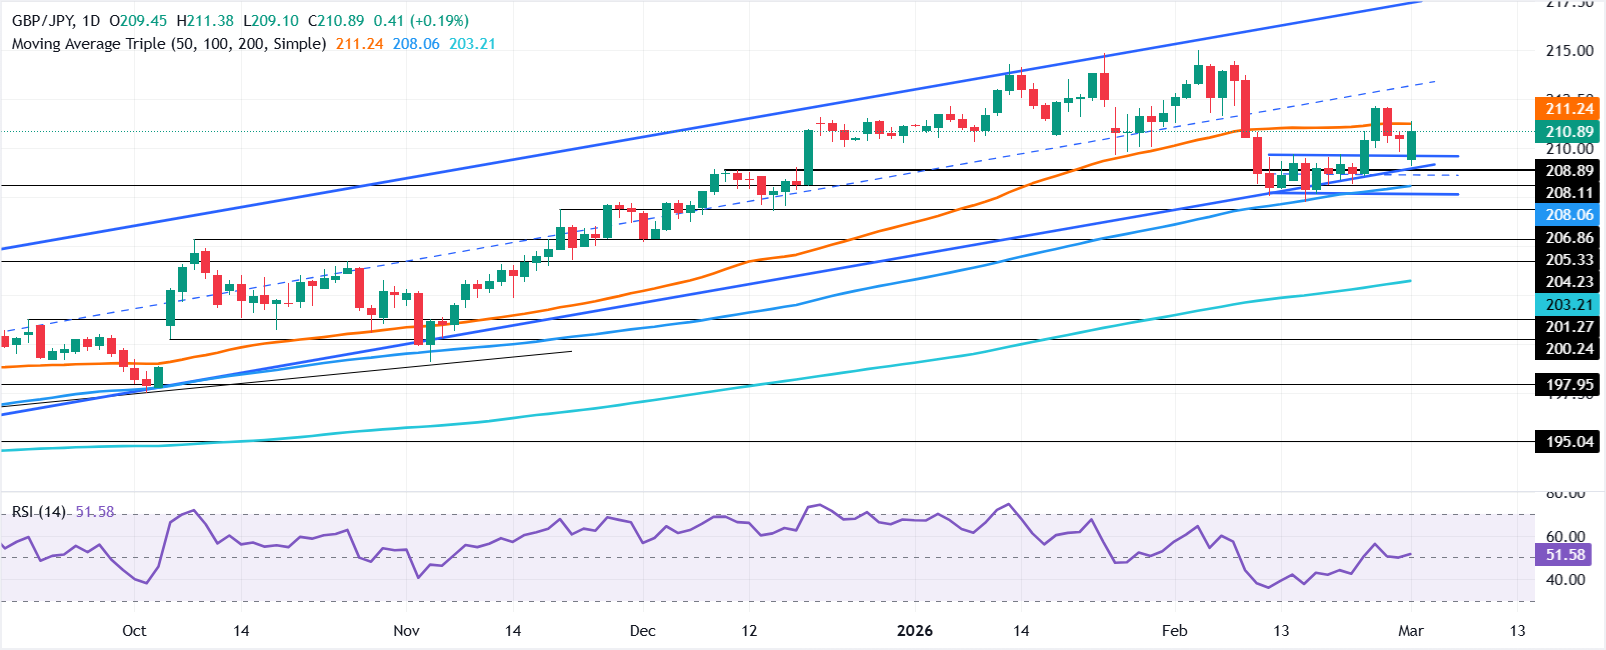
GBP/JPY Price Forecast: Technical outlook
The GBP/JPY pair began the week on a lower note, but as of writing, it is forming a ‘bullish engulfing’ candle chart pattern, which, if confirmed, could open the door for further gains.
Momentum shows that buyers remain in charge with the Relative Strength Index (RSI) bottoming around its 50-neutral line, aiming higher, an indication that bulls are stepping in.
A break above 211.00 clears the path for further gains, with the next key resistance level seen at the February 25 swing high of 212.12. If surpassed, GBP/JPY's next stop would be the February 10 high at 213.82, ahead of 214.00.
On the downside, if GBP/JPY extends its losses below 210.00, bring the day’s low of 209.35 into focus. On further weakness, the next demand zone would be 209.00 ahead of the 100-day Simple Moving Average (SMA) at 207.91
GBP/JPY Price Chart – Daily
Japanese Yen Price Today
The table below shows the percentage change of Japanese Yen (JPY) against listed major currencies today. Japanese Yen was the strongest against the Swiss Franc.
| USD | EUR | GBP | JPY | CAD | AUD | NZD | CHF | |
|---|---|---|---|---|---|---|---|---|
| USD | 1.14% | 0.61% | 0.83% | 0.33% | 0.53% | 1.04% | 1.46% | |
| EUR | -1.14% | -0.52% | -0.33% | -0.80% | -0.60% | -0.10% | 0.32% | |
| GBP | -0.61% | 0.52% | 0.19% | -0.28% | -0.09% | 0.42% | 0.85% | |
| JPY | -0.83% | 0.33% | -0.19% | -0.48% | -0.28% | 0.23% | 0.65% | |
| CAD | -0.33% | 0.80% | 0.28% | 0.48% | 0.20% | 0.70% | 1.13% | |
| AUD | -0.53% | 0.60% | 0.09% | 0.28% | -0.20% | 0.51% | 0.93% | |
| NZD | -1.04% | 0.10% | -0.42% | -0.23% | -0.70% | -0.51% | 0.42% | |
| CHF | -1.46% | -0.32% | -0.85% | -0.65% | -1.13% | -0.93% | -0.42% |
The heat map shows percentage changes of major currencies against each other. The base currency is picked from the left column, while the quote currency is picked from the top row. For example, if you pick the Japanese Yen from the left column and move along the horizontal line to the US Dollar, the percentage change displayed in the box will represent JPY (base)/USD (quote).
Author

Christian Borjon Valencia
FXStreet
Markets analyst, news editor, and trading instructor with over 14 years of experience across FX, commodities, US equity indices, and global macro markets.


