Silver Price Analysis: XAG/USD consolidated below six-week tops, around 38.2% Fibo.


  • Silver was seen consolidating its recent strong move up to multi-week tops.
  • The set-up favours bullish traders and supports prospects for further gains.
  • Any slide below the $24.00 mark could be seen as a dip-buying opportunity.

Silver now seems to have entered a bullish consolidation phase and was seen oscillating in a range just below mid-$24.00s, or six-week tops touched earlier this Thursday.

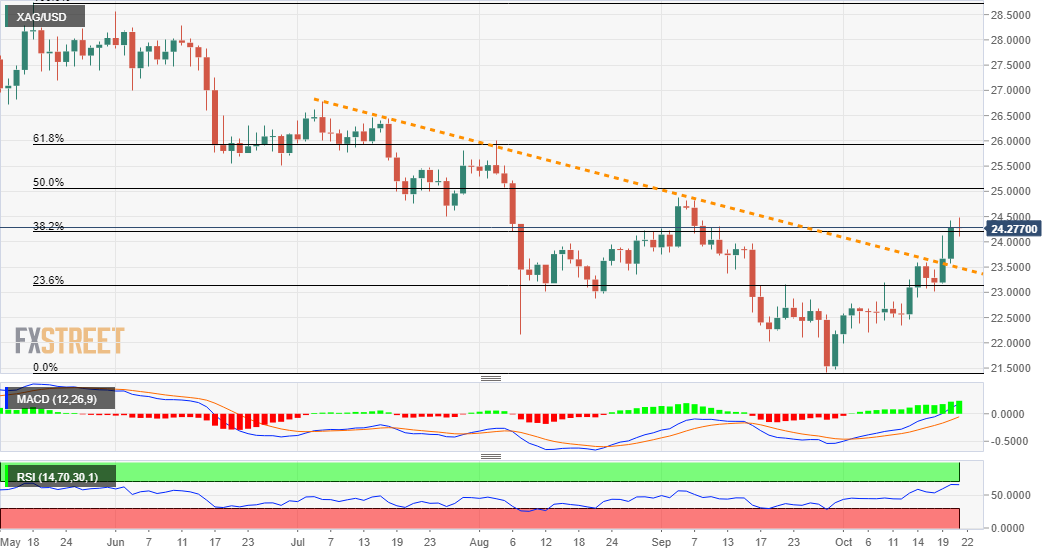
From a technical perspective, the overnight strong follow-through positive move validated this week's breakthrough a downward-sloping trend-line extending from July monthly swing highs. This comes on the back of the recent inverted head and shoulders bullish breakout and supports prospects for additional near-term gains.

The constructive set-up is reinforced by bullish technical indicators, which are still far from being in the overbought zone. That said, slightly overbought RSI (14) on the 4-hour chart failed to assist the XAG/USD to capitalize on its move beyond the 38.2% Fibonacci level of the $28.75-$21.42 downfall, at least for now.

Nevertheless, the bias remains tilted firmly in favour of bullish traders. Hence, a subsequent move towards testing September monthly swing highs, around the $24.80-85 region, remains a distinct possibility. Bulls might eventually aim to reclaim the key $25.00 psychological mark, which coincides with the 50% Fibo. level.

On the flip side, the $24.00 round-figure mark now seems to protect the immediate downside. Any subsequent decline could be seen as a buying opportunity near the $23.75-70 region. This, in turn, should help limit the corrective pullback near the mentioned trend-line support breakpoint, around the $23.50-45 region.

Silver daily chart

fxsoriginal

Technical levels to watch

XAG/USD

Overview
Today last price 24.28
Today Daily Change -0.01
Today Daily Change % -0.04
Today daily open 24.29
 
Trends
Daily SMA20 22.78
Daily SMA50 23.29
Daily SMA100 24.62
Daily SMA200 25.51
 
Levels
Previous Daily High 24.42
Previous Daily Low 23.57
Previous Weekly High 23.59
Previous Weekly Low 22.35
Previous Monthly High 24.87
Previous Monthly Low 21.42
Daily Fibonacci 38.2% 24.1
Daily Fibonacci 61.8% 23.9
Daily Pivot Point S1 23.77
Daily Pivot Point S2 23.25
Daily Pivot Point S3 22.92
Daily Pivot Point R1 24.62
Daily Pivot Point R2 24.94
Daily Pivot Point R3 25.46


Share: Feed news

Information on these pages contains forward-looking statements that involve risks and uncertainties. Markets and instruments profiled on this page are for informational purposes only and should not in any way come across as a recommendation to buy or sell in these assets. You should do your own thorough research before making any investment decisions. FXStreet does not in any way guarantee that this information is free from mistakes, errors, or material misstatements. It also does not guarantee that this information is of a timely nature. Investing in Open Markets involves a great deal of risk, including the loss of all or a portion of your investment, as well as emotional distress. All risks, losses and costs associated with investing, including total loss of principal, are your responsibility. The views and opinions expressed in this article are those of the authors and do not necessarily reflect the official policy or position of FXStreet nor its advertisers. The author will not be held responsible for information that is found at the end of links posted on this page.

If not otherwise explicitly mentioned in the body of the article, at the time of writing, the author has no position in any stock mentioned in this article and no business relationship with any company mentioned. The author has not received compensation for writing this article, other than from FXStreet.

FXStreet and the author do not provide personalized recommendations. The author makes no representations as to the accuracy, completeness, or suitability of this information. FXStreet and the author will not be liable for any errors, omissions or any losses, injuries or damages arising from this information and its display or use. Errors and omissions excepted.

The author and FXStreet are not registered investment advisors and nothing in this article is intended to be investment advice.

Recommended content


Recommended content

Editors’ Picks

USD/JPY jumps above 156.00 on BoJ's steady policy

USD/JPY jumps above 156.00 on BoJ's steady policy

USD/JPY has come under intense buying pressure, surging past 156.00 after the Bank of Japan kept the key rate unchanged but tweaked its policy statement. The BoJ maintained its fiscal year 2024 and 2025 core inflation forecasts, disappointing the Japanese Yen buyers. 

USD/JPY News

AUD/USD consolidates gains above 0.6500 after Australian PPI data

AUD/USD consolidates gains above 0.6500 after Australian PPI data

AUD/USD is consolidating gains above 0.6500 in Asian trading on Friday. The pair capitalizes on an annual increase in Australian PPI data. Meanwhile, a softer US Dollar and improving market mood also underpin the Aussie ahead of the US PCE inflation data. 

AUD/USD News

Gold price flatlines as traders look to US PCE Price Index for some meaningful impetus

Gold price flatlines as traders look to US PCE Price Index for some meaningful impetus

Gold price lacks any firm intraday direction and is influenced by a combination of diverging forces. The weaker US GDP print and a rise in US inflation benefit the metal amid subdued USD demand. Hawkish Fed expectations cap the upside as traders await the release of the US PCE Price Index.

Gold News

Sei Price Prediction: SEI is in the zone of interest after a 10% leap

Sei Price Prediction: SEI is in the zone of interest after a 10% leap

Sei price has been in recovery mode for almost ten days now, following a fall of almost 65% beginning in mid-March. While the SEI bulls continue to show strength, the uptrend could prove premature as massive bearish sentiment hovers above the altcoin’s price.

Read more

US economy: Slower growth with stronger inflation

US economy: Slower growth with stronger inflation

The US Dollar strengthened, and stocks fell after statistical data from the US. The focus was on the preliminary estimate of GDP for the first quarter. Annualised quarterly growth came in at just 1.6%, down from the 2.5% and 3.4% previously forecast.

Read more

Forex MAJORS

Cryptocurrencies

Signatures