- Silver edges higher for the third straight day and inches back closer to the multi-month top.
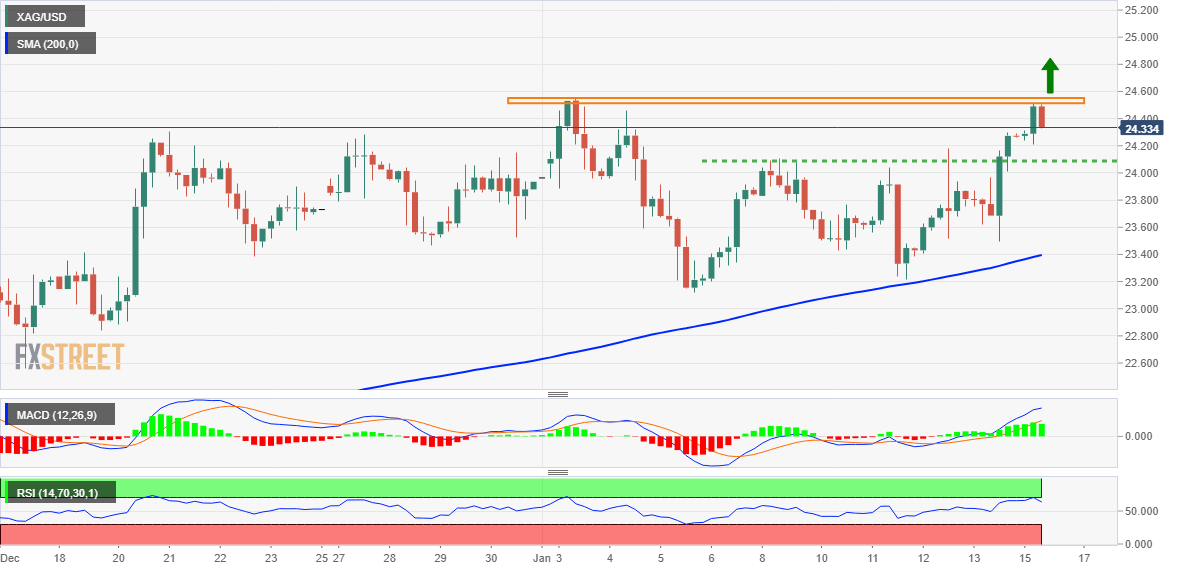
- Resistance from a key long-term trend line at the current highs could see kick back from technical sellers.
- A convincing break below the $24.50 mark would ideally be required to negate the near-term positive bias.
Silver prolongs the positive trend for the third straight day on Monday and steadily climbs back closer to its highest level since April 22 touched earlier this month. The white metal gives back some of its intraday gains heading into the European session after meeting tough resistance from a major trend line and a daily close above this line, at around $24.50 would provide the confirmation required to extend gains and begin a new bullish breakout phase.
From a technical perspective, oscillators on the daily chart are holding comfortably in the positive territory and are still not in the overbought zone suggesting more potential for upside, however, the 14-period Realtive Strength Index (RSI) which measures momentum is bearishly diverging bearishly with price action at the current peak when compared to the January 3 peak where it was much stronger, indicating underlying weakness in the latest run up.
On hourly charts RSI (14) hovers around the 70 mark (representing overbought conditions) and warrants some caution. Nevertheless, the stage still seems set for an eventual breakout through the $24.50-$24.55 region and a subsequent move towards reclaiming the $25.00 psychological mark for the first time since April 2022. Some follow-through buying has the potential to lift the XAG/USD to the $25.35-$25.40 hurdle.
On the flip side, the $24.10-$24.00 resistance breakpoint now seems to protect the immediate downside. Any further pullback is more likely to attract fresh buyers and remain limited near the 200-SMA on the 4-hour chart, currently around the $23.30-$23.25 area, also the lows of the current consolidation range. This is followed by the $23.00 round figure, which if broken decisively will negate the positive outlook and shift the near-term bias much more in favour of bearish traders.
The XAG/USD might then accelerate the fall towards the $22.60-$22.55 region and weaken further towards the next relevant support near the $22.10-$22.00 zone.
Silver 4-hour chart
Key levels to watch
Information on these pages contains forward-looking statements that involve risks and uncertainties. Markets and instruments profiled on this page are for informational purposes only and should not in any way come across as a recommendation to buy or sell in these assets. You should do your own thorough research before making any investment decisions. FXStreet does not in any way guarantee that this information is free from mistakes, errors, or material misstatements. It also does not guarantee that this information is of a timely nature. Investing in Open Markets involves a great deal of risk, including the loss of all or a portion of your investment, as well as emotional distress. All risks, losses and costs associated with investing, including total loss of principal, are your responsibility. The views and opinions expressed in this article are those of the authors and do not necessarily reflect the official policy or position of FXStreet nor its advertisers. The author will not be held responsible for information that is found at the end of links posted on this page.
If not otherwise explicitly mentioned in the body of the article, at the time of writing, the author has no position in any stock mentioned in this article and no business relationship with any company mentioned. The author has not received compensation for writing this article, other than from FXStreet.
FXStreet and the author do not provide personalized recommendations. The author makes no representations as to the accuracy, completeness, or suitability of this information. FXStreet and the author will not be liable for any errors, omissions or any losses, injuries or damages arising from this information and its display or use. Errors and omissions excepted.
The author and FXStreet are not registered investment advisors and nothing in this article is intended to be investment advice.
Recommended content
Editors’ Picks
EUR/USD edges lower toward 1.0700 post-US PCE
EUR/USD stays under modest bearish pressure but manages to hold above 1.0700 in the American session on Friday. The US Dollar (USD) gathers strength against its rivals after the stronger-than-forecast PCE inflation data, not allowing the pair to gain traction.
GBP/USD retreats to 1.2500 on renewed USD strength
GBP/USD lost its traction and turned negative on the day near 1.2500. Following the stronger-than-expected PCE inflation readings from the US, the USD stays resilient and makes it difficult for the pair to gather recovery momentum.
Gold struggles to hold above $2,350 following US inflation
Gold turned south and declined toward $2,340, erasing a large portion of its daily gains, as the USD benefited from PCE inflation data. The benchmark 10-year US yield, however, stays in negative territory and helps XAU/USD limit its losses.
Bitcoin Weekly Forecast: BTC’s next breakout could propel it to $80,000 Premium
Bitcoin’s recent price consolidation could be nearing its end as technical indicators and on-chain metrics suggest a potential upward breakout. However, this move would not be straightforward and could punish impatient investors.
Week ahead – Hawkish risk as Fed and NFP on tap, Eurozone data eyed too
Fed meets on Wednesday as US inflation stays elevated. Will Friday’s jobs report bring relief or more angst for the markets? Eurozone flash GDP and CPI numbers in focus for the Euro.