|

Silver Price Analysis: XAG/USD bulls have the upper hand, remains on track to conquer $25.00

  • Silver is seen oscillating in a narrow range below a three-month top touched on Monday.
  • The technical setup favours bulls and supports prospects for additional near-term gains.
  • Any meaningful dip could be seen as a buying opportunity and is likely to remain limited.

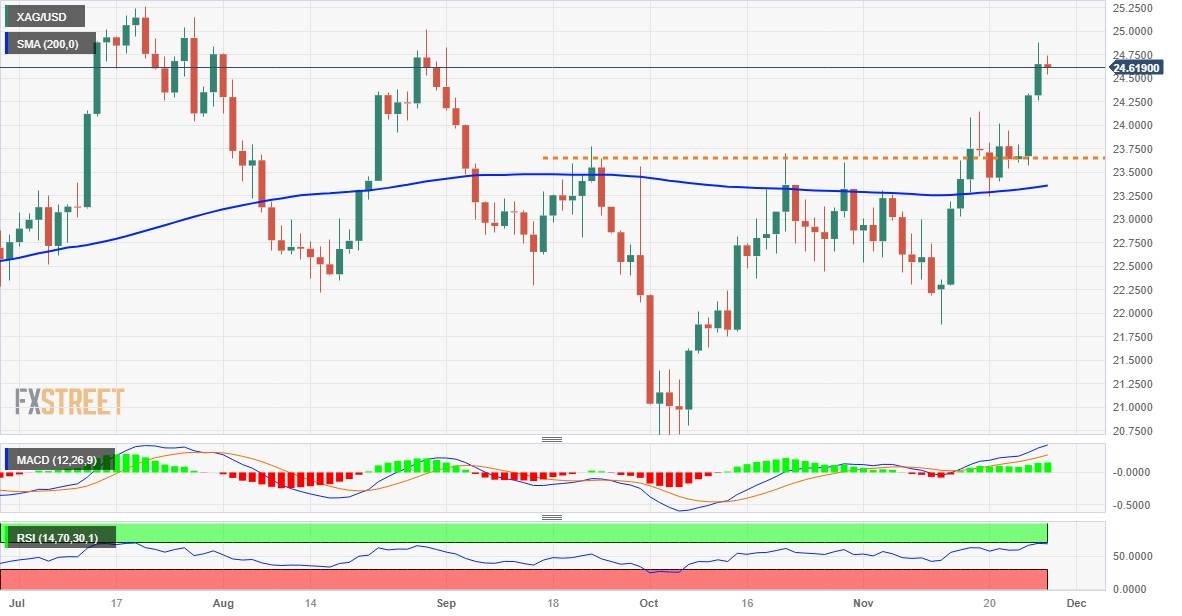
Silver (XAG/USD) enters a bullish consolidation phase and oscillates in a narrow trading band just above mid-$24.00s through the first half of the European session on Tuesday. The white metal, however, remains well within the striking distance of a near three-month high touched on Monday and seems poised to prolong its recent strong appreciating move witnessed over the past two weeks or so.

From a technical perspective, the recent breakout through the 200-day Simple Moving Average (SMA) and a subsequent strength beyond the $24.00 round figure was seen as a fresh trigger for bullish traders. Furthermore, oscillators on the daily chart are holding comfortably in the positive territory and are still far from being in the overbought zone, validating the near-term positive outlook for the XAG/USD.

Hence, any meaningful downside might still be seen as a buying opportunity near the aforementioned resistance breakpoint now turned support near the $24.00 mark. This should help limit the downside for the XAG/USD near the 200-day SMA, currently pegged near the $23.35-$23.30 region. That said, a convincing break below might prompt some technical selling and pave the way for some meaningful downside.

The XAG/USD, meanwhile, still seems poised to make a fresh attempt to conquer the $25.00 psychological mark. The next relevant hurdle is pegged near the $25.25 region, or the YTD peak touched in May, which if cleared decisively will reaffirm the bullish bias. The white metal might then accelerate the positive momentum towards reclaiming the $26.00 round figure for the first time since April 2022.

Silver daily chart
fxsoriginal

Technical levels to watch

XAG/USD

Overview
Today last price24.6
Today Daily Change-0.05
Today Daily Change %-0.20
Today daily open24.65
 
Trends
Daily SMA2023.23
Daily SMA5022.8
Daily SMA10023.27
Daily SMA20023.34
 
Levels
Previous Daily High24.88
Previous Daily Low24.26
Previous Weekly High24.33
Previous Weekly Low23.25
Previous Monthly High23.7
Previous Monthly Low20.68
Daily Fibonacci 38.2%24.65
Daily Fibonacci 61.8%24.5
Daily Pivot Point S124.32
Daily Pivot Point S223.98
Daily Pivot Point S323.7
Daily Pivot Point R124.93
Daily Pivot Point R225.21
Daily Pivot Point R325.55

Author

Haresh Menghani

Haresh Menghani is a detail-oriented professional with 10+ years of extensive experience in analysing the global financial markets.


More from Haresh Menghani
Share:

Editor's Picks

GBP/USD clings to 1.3500 amid marginal losses

GBP/USD alternates gains with losses around the 1.3500 neighbourhood on Tuesday. Indeed, Cable struggles to further extend its incipient recovery in a context of continuous instability in the Middle East and modest gains in the Greenback.

EUR/USD alternates gains with losses near 1.1540

EUR/USD navigates a tight range near 1.1550 in the latter part of Tuesday’s NA session. The US Dollar’s vacillating price action accompanies the pair while market participants gear up for the crucial US inflation data due on Wednesday.

Gold loses the grip below $4,400

Gold retreats from its earlier tops and briefly revisited the $4,350 region per troy ounce on Tuesday. The yellow metal’s modest retracement follows lacklustre gains in the US Dollar and declining US Treasury yields across the curve, all amid steady uncertainty from the geopolitical landscape.

Shiba Inu Price Forecast: SHIB extends sell-off despite surging futures Open Interest
Shiba Inu (SHIB) maintains a bearish outlook on Tuesday, as it edges lower at $0.00000450. This marks the seventh day the meme coin has sustained a sell-off, weighed down by a weak technical structure. Shiba Inu derivatives continue to gain momentum, with perpetual futures Open Interest (OI) rising to 11.08 trillion SHIB on Tuesday, from 10.46 trillion the day before.
The inflation narrative is still way more important than the employment story
Core bonds sold off yesterday with the belly of the curve slightly underperforming in the US while European curves showed more of a bear flattening. Daily changes on the US curve varied between +4.7 bps (2-yr) and +6.4 bps (7-yr).
9-3: Is the Federal Reserve’s vote tally Warsh's new forward guidance?
The rate did not move. Neither did the statement, and that’s the more interesting fact. Set the July 29 Federal Open Market Committee (FOMC) statement beside the one issued on June 17, and the two documents are identical apart from a single verb and a paragraph at the bottom naming three dissenters.