|

Silver Price Analysis: XAG/USD breaks through a multi-month descending trend-line hurdle

  • Silver rallied to over one-month tops during the early European session on Tuesday.
  • The momentum seems strong enough to push the XAG/USD beyond the $24.00 mark.

Silver caught aggressive bids on Tuesday and shot to one-month tops, around the $23.70 region during the early European session.

From a technical perspective, the XAG/USD showed some resilience below the 200-period SMA on the 4-hour chart and managed to defend the $23.00 mark for the second consecutive session on Monday. The subsequent positive move validated the recent bullish breakout through an inverted head and shoulders neckline. This, in turn, supports prospects for a further near-term appreciating move.

Silver 4-hour chart

fxsoriginal

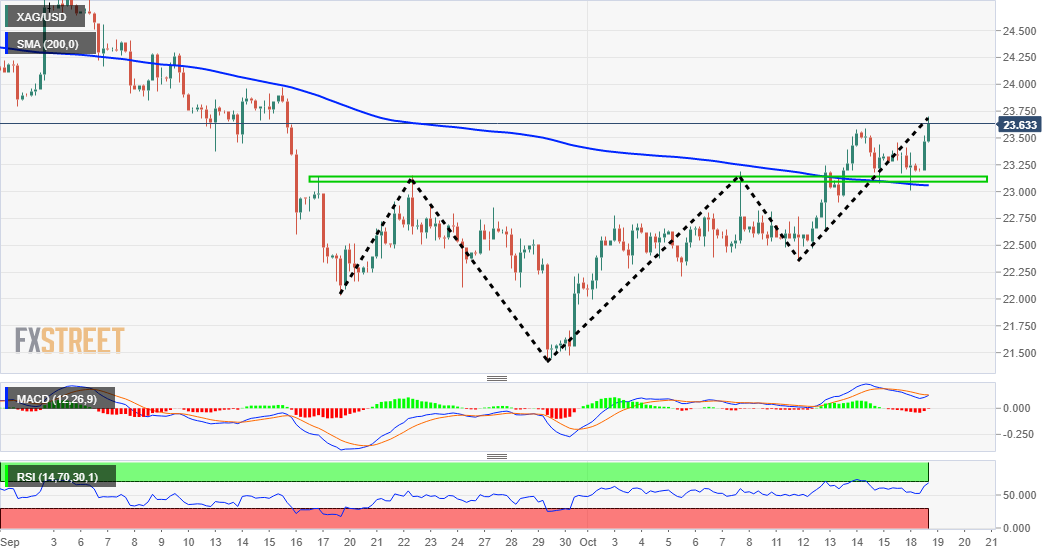
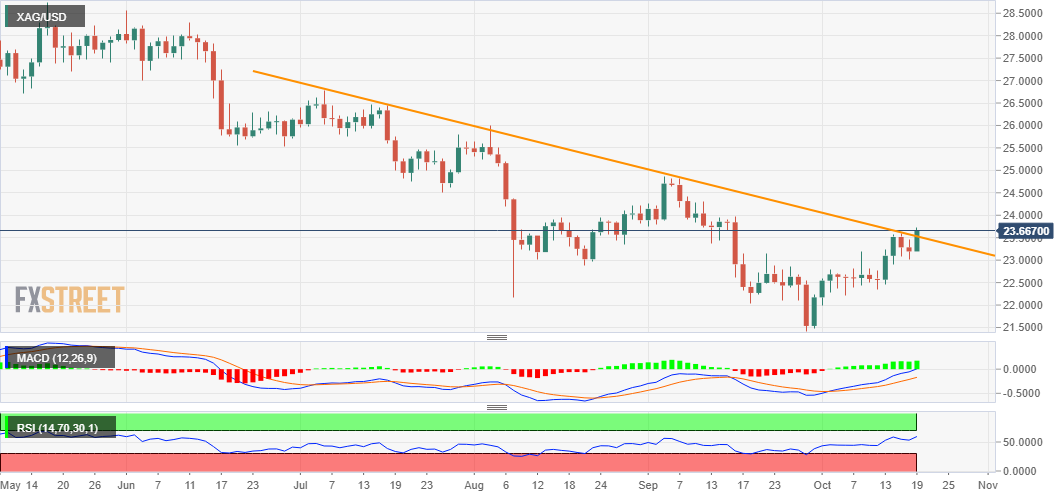
The constructive setup is reinforced by the fact that technical indicators on the daily chart have just started moving into the bullish territory and are still far from being in the overbought zone. Bulls might now be looking to build on the momentum further beyond a downward-sloping trend-line resistance, extending from July monthly swing highs, around the $26.75-80 region.

Silver daily chart

fxsoriginal

Nevertheless, the XAG/USD seems all set to extend its recent recovery move from YTD lows and aim to reclaim the $24.00 round-figure mark. This is followed by resistance near the $24.15-20 region, above which the momentum could further get extended towards the next relevant hurdle around the $24.75-80 region. The white metal could eventually climb to the key $25.00 psychological mark.

On the flip side, the $23.50 region now seems to protect the immediate downside. Any subsequent pullback might still be seen as a buying opportunity near the $23.00 mark, which should act as a strong near-term base for the XAG/USD and a key pivotal point for traders. A convincing break below might prompt some technical selling and accelerate the corrective fall towards the $22.75-70 region.

Technical levels to watch

XAG/USD

Overview
Today last price23.69
Today Daily Change0.50
Today Daily Change %2.16
Today daily open23.19
 
Trends
Daily SMA2022.65
Daily SMA5023.27
Daily SMA10024.7
Daily SMA20025.52
 
Levels
Previous Daily High23.46
Previous Daily Low23.01
Previous Weekly High23.59
Previous Weekly Low22.35
Previous Monthly High24.87
Previous Monthly Low21.42
Daily Fibonacci 38.2%23.18
Daily Fibonacci 61.8%23.29
Daily Pivot Point S122.99
Daily Pivot Point S222.78
Daily Pivot Point S322.54
Daily Pivot Point R123.43
Daily Pivot Point R223.66
Daily Pivot Point R323.87

Author

Haresh Menghani

Haresh Menghani is a detail-oriented professional with 10+ years of extensive experience in analysing the global financial markets.

More from Haresh Menghani
Share:

Editor's Picks

EUR/USD eyes nine-day EMA barrier after rebounding from 1.1600

EUR/USD gains ground after registering modest losses in the previous session, trading around 1.1620 during the Asian hours on Friday. The technical analysis of the daily chart suggests an ongoing bearish bias as the pair remains within the descending channel pattern.

GBP/USD drifts lower heading into NFP range

GBP/USD edged lower by 0.2% on Thursday, settling close to 1.3350 in a strained trading session that kept the pair pinned near three-month lows. Price briefly recovered earlier in the day on reports that Iran had indirectly signaled openness to talks with the CIA, but the bounce faded as Israeli officials reportedly advised Washington to disregard the overture. 

Gold recovers above $5,100 ahead of US NFP report

Gold price jumps back above $5,100 in the Asian session on Friday. The precious metal regains traction, helped by a fresh bout of US Dollar selling and persisting risk-off flows. The US employment report for February will take center stage later on Friday. 

Ethereum pull in $169M as validators pile in to stake ETH

US spot Ethereum exchange-traded funds recorded $169 million in net inflows on Wednesday, marking the largest daily intake in two months, according to SoSoValue data. The rise in inflows signals renewed institutional interest in Ethereum amid broader market volatility.

The market compass is pointing at a barrel of Oil

The Asian open is arriving with equities leaning the wrong way, and the reason is not complicated. The market’s compass needle has snapped firmly toward crude. In this tape, oil is not just another input price; it is the gravitational center around which every asset class is orbiting.

Ripple tests recovery strength amid steady ETF inflows, growing retail interest

Ripple (XRP) continues to demonstrate notable resilience as the cryptocurrency market navigates the persistent war in the Middle East after the United States (US) and Israel attacked Iran on Saturday.