|

Silver Price Analysis: XAG/USD bears flirt with 200-hour SMA, below mid-$23.00s

  • Silver meets with some supply on Wednesday and challenges the 200-hour SMA.
  • The technical setup gradually seems to be shifting in favour of bearish traders.
  • A sustained strength beyond $24.00 is needed to negate the negative outlook.

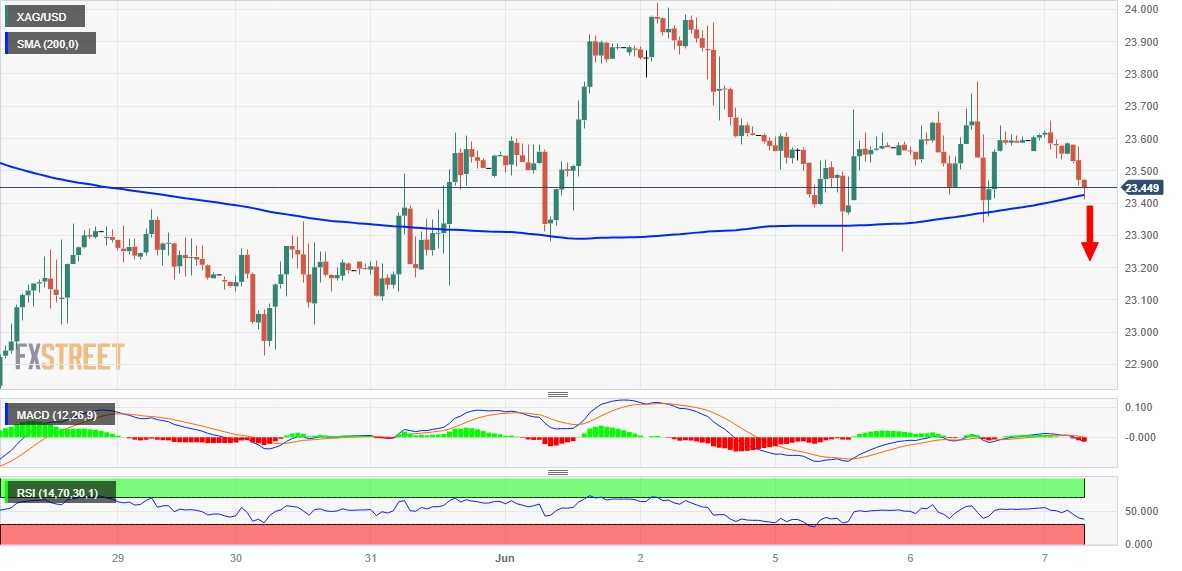
Silver comes under some selling pressure on Wednesday and sticks to its modest intraday losses through the early part of the European session. The white metal is currently placed just below the mid-$23.00s, with bears now awaiting a break below the 200-hour Simple Moving Average (SMA) before placing fresh bets and positioning for any further losses.

Against the backdrop of last week's rejection slide from the $24.00 mark, some follow-through selling will suggest that the recent bounce from a two-month low has run its course and turn the XAG/USD vulnerable amid bearish oscillators on the daily chart. The subsequent downfall has the potential to drag the commodity towards the $23.00 round figure en route to the next relevant support near the $22.70-$22.65 region, or over a two-month low touched in May.

The XAG/USD could eventually drop to the $22.00 mark, which represents a technically significant 200-day SMA, which should act as a strong base and help limit any further losses. That said, a sustained break below will be seen as a fresh trigger for bearish traders and set the stage for the resumption of the recent pullback from over a one-year high, around the $26.15 region, touched in May.

On the flip side, the weekly top, around the $23.75 area set on Tuesday, now seems to act as an immediate barrier ahead of the $24.00 mark. This is closely followed by the $24.15-$24.20 horizontal resistance, which if cleared decisively could trigger a near-term short-covering rally. The XAG/USD might then surpass the $24.45-$24.50 intermediate hurdle and climb to the $24.80 zone before aiming toe reclaim the $25.00 psychological mark.

Silver 1-hour chart

fxsoriginal

Key levels to watch

XAG/USD

Overview
Today last price23.42
Today Daily Change-0.18
Today Daily Change %-0.76
Today daily open23.6
 
Trends
Daily SMA2023.66
Daily SMA5024.47
Daily SMA10023.34
Daily SMA20022.17
 
Levels
Previous Daily High23.78
Previous Daily Low23.34
Previous Weekly High24.02
Previous Weekly Low22.93
Previous Monthly High26.14
Previous Monthly Low22.68
Daily Fibonacci 38.2%23.61
Daily Fibonacci 61.8%23.51
Daily Pivot Point S123.36
Daily Pivot Point S223.13
Daily Pivot Point S322.93
Daily Pivot Point R123.8
Daily Pivot Point R224.01
Daily Pivot Point R324.24

Author

Haresh Menghani

Haresh Menghani is a detail-oriented professional with 10+ years of extensive experience in analysing the global financial markets.

More from Haresh Menghani
Share:

Editor's Picks

EUR/USD looks apathetic around 1.1770

EUR/USD comes under renewed pressure on Tuesday, deflating below the 1.1800 support and reversing two consecutive days of gains. The pair’s decline follows the persistent move higher in the US Dollar, as trade uncertainty dominates the sentiment ahead of President Trump’s SOTU speech.

GBP/USD regains 1.3500 and above

GBP/USD extends its advance for the third day in a row on Tuesday, this time retesting the area beyond the 1.3500 hurdle. Cable’s uptick comes despite decent gains in the Greenback and the dovish message from the BoE’s Bailey at the UK Parliament.

Gold appears offered around $5,150

Gold is giving back a good portion of the recent multi-day rally, receding to the $5,150 zone per troy ounce amid the decent bounce in the US Dollar and mixed US Treasuty yields. In the meantime, markets’ attention remain on upcoming comments from Fed speakers.

Ripple’s DeFi shift in focus: Navigating XRPL EVM sidechain growth, XRPFi migration and liquidity

Ripple (XRP) has continued to trade under pressure, extending its decline by approximately 63% from the record high of $3.66 in July. The remittance token is trading above support at $1.35, while its upside appears limited by key supply zones, starting with $1.40, at the time of writing on Tuesday.

The Citrini report: How a debatable AI narrative can shake Wall Street

That AI-related headline alone was enough to rattle investors.US stocks slid sharply on Monday after a widely circulated Citrini Research memo outlined a hypothetical “2028 Global Intelligence Crisis”, warning that rapid AI adoption could push US unemployment into double digits as early as by mid-2028.

XRP pressured by weak ETF flows and declining retail interest

Ripple (XRP) is edging lower, trading above its intraday low of $1.32 at the time of writing on Tuesday. The decline from its weekly opening of $1.39 reflects heightened volatility in the broader cryptocurrency market, accentuated by tariff-triggered uncertainty.