Silver Price Analysis: XAG/USD approaches 200-day SMA/61.8% Fibo. confluence hurdle


  • Silver turns positive for the fourth straight day and climbs back closer to a multi-week high.
  • The technical setup seems tilted in favour of bulls and supports prospects for further gains.
  • Bulls might wait for a move beyond the $23.30-$23.35 confluence before placing fresh bets.

Silver (XAG/USD) reverses an intraday dip to the $22.85 area and builds on its intraday upward trajectory through the first half of the European session on Friday. The white metal currently trades around the $23.20 region, up nearly 0.50% for the day, and seems poised to prolong its recent goodish recovery from a seven-month low touched on October 3.

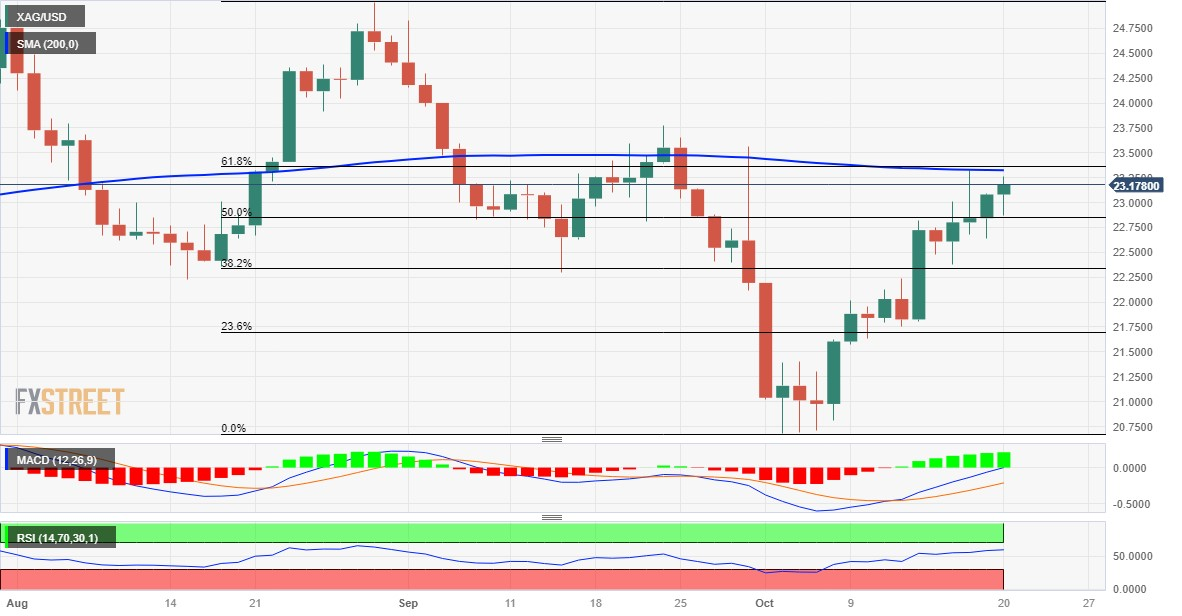
From a technical perspective, the emergence of some dip-buying near the 50% Fibonacci retracement level of the August-October downfall validates the constructive outlook for the XAG/USD. Furthermore, oscillators on the daily chart have just started gaining positive traction and support prospects for a further appreciating move. That said, it will still be prudent to wait for a sustained move beyond the $23.30-$23.35 confluence hurdle – comprising the 100-day and the 200-day Simple Moving Averages (SMAs) and the 61.8% Fibo. level – before placing fresh bullish bets.

The XAG/USD might then climb to the next relevant resistance near the $23.75-$23.80 region (September 22 high) and then aim to reclaim the $24.00 round figure for the first time since early September. The positive momentum could get extended further towards the $24.30-$24.35 resistance zone en route to the August monthly swing high, around the $25.00 psychological mark.

On the flip side, the 50% Fibo. level, around the $22.85 region, might continue to protect the immediate downside ahead of the $22.70-$22.65 horizontal support. This is followed by the weekly trough, around the $22.40-$22.35 zone, which nears the 38.2% Fibo. level and should act as a key pivotal point. A convincing break below might shift the near-term bias back in favour of bearish traders and prompt aggressive technical selling around the XAG/USD.

Silver might then turn vulnerable to accelerate the fall further below the $22.00 mark, towards the 23.6% Fibo. level, around the $21.75 area. The subsequent downfall has the potential to drag the XAG/USD to the $21.35-$21.30 intermediate support en route to the $21.00 mark and back towards retesting a seven-month low, around the $20.70-$20.65 zone, or a seven-month low touched on October 3.

Silver daily chart

fxsoriginal

Technical levels to watch

XAG/USD

Overview
Today last price 23.22
Today Daily Change 0.14
Today Daily Change % 0.61
Today daily open 23.08
 
Trends
Daily SMA20 22.22
Daily SMA50 22.92
Daily SMA100 23.3
Daily SMA200 23.33
 
Levels
Previous Daily High 23.09
Previous Daily Low 22.64
Previous Weekly High 22.82
Previous Weekly Low 21.57
Previous Monthly High 24.82
Previous Monthly Low 22.12
Daily Fibonacci 38.2% 22.92
Daily Fibonacci 61.8% 22.81
Daily Pivot Point S1 22.79
Daily Pivot Point S2 22.49
Daily Pivot Point S3 22.34
Daily Pivot Point R1 23.23
Daily Pivot Point R2 23.38
Daily Pivot Point R3 23.68


Share: Feed news

Information on these pages contains forward-looking statements that involve risks and uncertainties. Markets and instruments profiled on this page are for informational purposes only and should not in any way come across as a recommendation to buy or sell in these assets. You should do your own thorough research before making any investment decisions. FXStreet does not in any way guarantee that this information is free from mistakes, errors, or material misstatements. It also does not guarantee that this information is of a timely nature. Investing in Open Markets involves a great deal of risk, including the loss of all or a portion of your investment, as well as emotional distress. All risks, losses and costs associated with investing, including total loss of principal, are your responsibility. The views and opinions expressed in this article are those of the authors and do not necessarily reflect the official policy or position of FXStreet nor its advertisers. The author will not be held responsible for information that is found at the end of links posted on this page.

If not otherwise explicitly mentioned in the body of the article, at the time of writing, the author has no position in any stock mentioned in this article and no business relationship with any company mentioned. The author has not received compensation for writing this article, other than from FXStreet.

FXStreet and the author do not provide personalized recommendations. The author makes no representations as to the accuracy, completeness, or suitability of this information. FXStreet and the author will not be liable for any errors, omissions or any losses, injuries or damages arising from this information and its display or use. Errors and omissions excepted.

The author and FXStreet are not registered investment advisors and nothing in this article is intended to be investment advice.

Recommended content


Recommended content

Editors’ Picks

EUR/USD retreats from multi-week highs, holds above 1.0800

EUR/USD retreats from multi-week highs, holds above 1.0800

After climbing to its highest level in over a month above 1.0850 with the immediate reaction to the April inflation data from the US, EUR/USD erased a portion of its daily gains and declined below this level. The improvement seen in risk mood, however, helps the pair hold its ground.

EUR/USD News

GBP/USD clings to daily gains above 1.2600

GBP/USD clings to daily gains above 1.2600

GBP/USD pulled away from the monthly high it set above 1.2650 but managed to stabilize in positive territory above 1.2600. The US Dollar stays under modest bearish pressure as markets assess the underlying details of the inflation report and how they could influence the Fed's rate outlook.

GBP/USD News

Gold reaches fresh monthly highs, aims for $2,400

Gold reaches fresh monthly highs, aims for $2,400

Gold trades modestly higher on the day above $2,360 in the American session. The data from the US showed that annual inflation edged lower to 3.4% in April as expected. The benchmark 10-year US Treasury bond yield stays in the red below 4.4%, allowing XAU/USD to keep its footing.

Gold News

Ripple’s discounts for institutional clients stir debate among attorneys discussing SEC lawsuit

Ripple’s discounts for institutional clients stir debate among attorneys discussing SEC lawsuit

Ripple price consolidates in a tight range around $0.50 on Wednesday as the Securities and Exchange Commission (SEC) legal battle against payment-remittance firm Ripple intensifies with two key issues in focus this week. 

Read more

US inflation and Retail Sales data add to pressure on Fed to signal rate cut

US inflation and Retail Sales data add to pressure on Fed to signal rate cut

The US CPI report for April was mostly in line with expectations. The annual rate for headline price growth fell to 3.4% from 3.5%, while the core rate declined to 3.6% from 3.8%. 

Read more

Forex MAJORS

Cryptocurrencies

Signatures