|

Silver Price Analysis: XAG/USD advances to multi-week top, above 50% Fibo. of August-September fall

  • Silver continues scaling higher on Friday and rallies to a nearly three-week high.
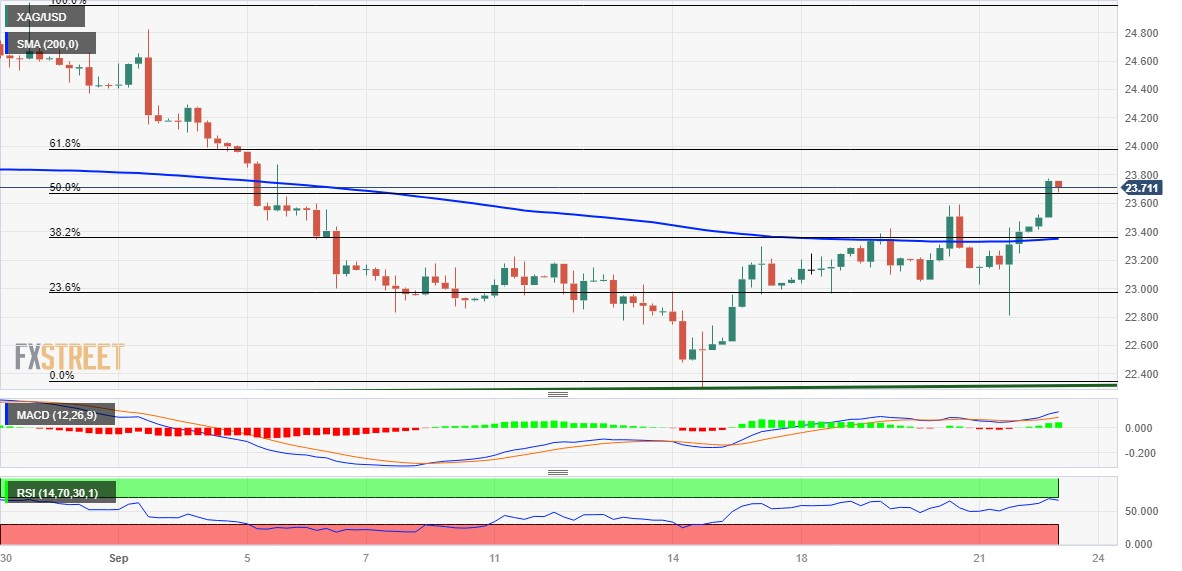
  • A move beyond the 50% Fibo. might have set the stage for a further move up.
  • Any corrective decline is more likely to find support near the $23.30 confluence.

Silver builds on the previous day's solid recovery move from the $22.80 area, or the weekly low, and gains strong follow-through traction on Friday. This marks the third successive day of a positive move, also the fifth in the previous six, and lifts the white metal to a two-and-half-week peak, around the $23.75 region during the early part of the European session.

From a technical perspective, a move beyond the 50% Fibonacci retracement level of the August-September downfall could be seen as a fresh trigger for the XAG/USD bulls. Furthermore, oscillators on the daily chart have just started moving in the positive territory and support prospects for a further appreciating move. Hence, a subsequent strength towards reclaiming the $24.00 round figure, which coincides with the 61.8% Fibol level, looks like a distinct possibility.

Some follow-through buying will set the stage for an extension of the recent rally from an ascending trend line extending from the June swing low. The XAG/USD might then accelerate the momentum beyond the $24.30-$24.35 intermediate hurdle, towards the $25.00 psychological mark, or the August monthly swing high. The next relevant hurdle is pegged near the July peak, around the $25.25 region, which if cleared decisively should pave the way for additional gains.

On the flip side, any meaningful corrective slide now seems to find decent support near the $23.30 confluence, comprising the 200-period Simple Moving Average (SMA) on the 4-hour chart and the 38.2% Fibo. The next relevant support is pegged near the $23.00 round figure, below which the XAG/USD could slide back to retest the $22.30 support, or a nearly one-month low touched last Thursday. A convincing break below will shift the bias in favour of bearish traders.

Silver 4-hour chart

fxsoriginal

Technical levels to watch

XAG/USD

Overview
Today last price23.7
Today Daily Change0.29
Today Daily Change %1.24
Today daily open23.41
 
Trends
Daily SMA2023.54
Daily SMA5023.69
Daily SMA10023.65
Daily SMA20023.47
 
Levels
Previous Daily High23.47
Previous Daily Low22.81
Previous Weekly High23.29
Previous Weekly Low22.3
Previous Monthly High25.02
Previous Monthly Low22.23
Daily Fibonacci 38.2%23.22
Daily Fibonacci 61.8%23.06
Daily Pivot Point S122.99
Daily Pivot Point S222.57
Daily Pivot Point S322.33
Daily Pivot Point R123.65
Daily Pivot Point R223.89
Daily Pivot Point R324.31

Author

Haresh Menghani

Haresh Menghani is a detail-oriented professional with 10+ years of extensive experience in analysing the global financial markets.

More from Haresh Menghani
Share:

Editor's Picks

EUR/USD slumps below 1.1750 as USD benefits from risk-aversion

EUR/USD comes under renewed bearish pressure in the European session and trades below 1.1750 following a recovery attempt earlier in the day. The US Dollar gathers strength and weighs on the pair as investors seek refuge in the wake of Israel and the United States' joint attack on Iran.

GBP/USD targets 1.3500 barrier near moving averages

GBP/USD rebounds from the daily losses, trading around 1.3450 during the Asian hours on Monday. The technical analysis of the daily chart indicates an ongoing bearish bias, as the pair trades within a descending channel pattern.

Gold surges on safe-haven demand, rises above $5,400

Gold benefits from intense risk-aversion on Monday and climbs above $5,400, setting a fresh monthly-high in the process. Tensions in the Middle East remain high as Israel and Hezbollah continue to exchange strikes following the US-Israel joint attack on Iran over the weekend.

Bitcoin, Ethereum and Ripple under pressure as key supports face breakdown risk

Bitcoin, Ethereum, and Ripple prices trade on the back foot at the start of this week on Monday, after extending losses in the previous week. BTC is on the brink of a breakdown, ETH is capped below key resistance, and XRP risks a crack of the trendline.

The market is paying for insurance, not apocalypse

As expected, this morning felt less like a Monday market open and more like a fire drill. Futures screens flickered red. S&P contracts down almost 1%. Nasdaq off 1.2%. Brent leaped 13% through $80. Gold rose 1.6% toward $5350 before paring some gains. The dollar is strutting mildly. The Swiss franc is quietly doing what it always does in a storm, catching some safe-haven flows.

Pi Network Price Forecast: Core team offloads supply, weighing on PI recovery

Pi Network  hovers below $0.1700, broadly steady at press time on Monday, attempting a recovery after a 2% loss the previous day. Sunday’s decline aligned with nearly 49 million PI tokens offloaded by the Pi Foundation, implying a spike in supply pressure that capped the prevailing four-day recovery.