|

Silver Price Analysis: Silver price in steep sell-off after touching top of four-year range

  • Silver price is declining after touching the top of a four-year consolidation range at roughly $30.00. 
  • XAG/USD has fallen to $27.00 and could decline further with support not materializing till $26.00. 

Silver (XAG/USD) price has continued to sell-off after being rejected by the top of a long-term range at just below $30.00 (green line) on April 12.

The precious metal is now in the midst of a steep decline and will probably continue lower till support materializes from the top of a smaller year-long range at $26.00.

Silver Daily Chart

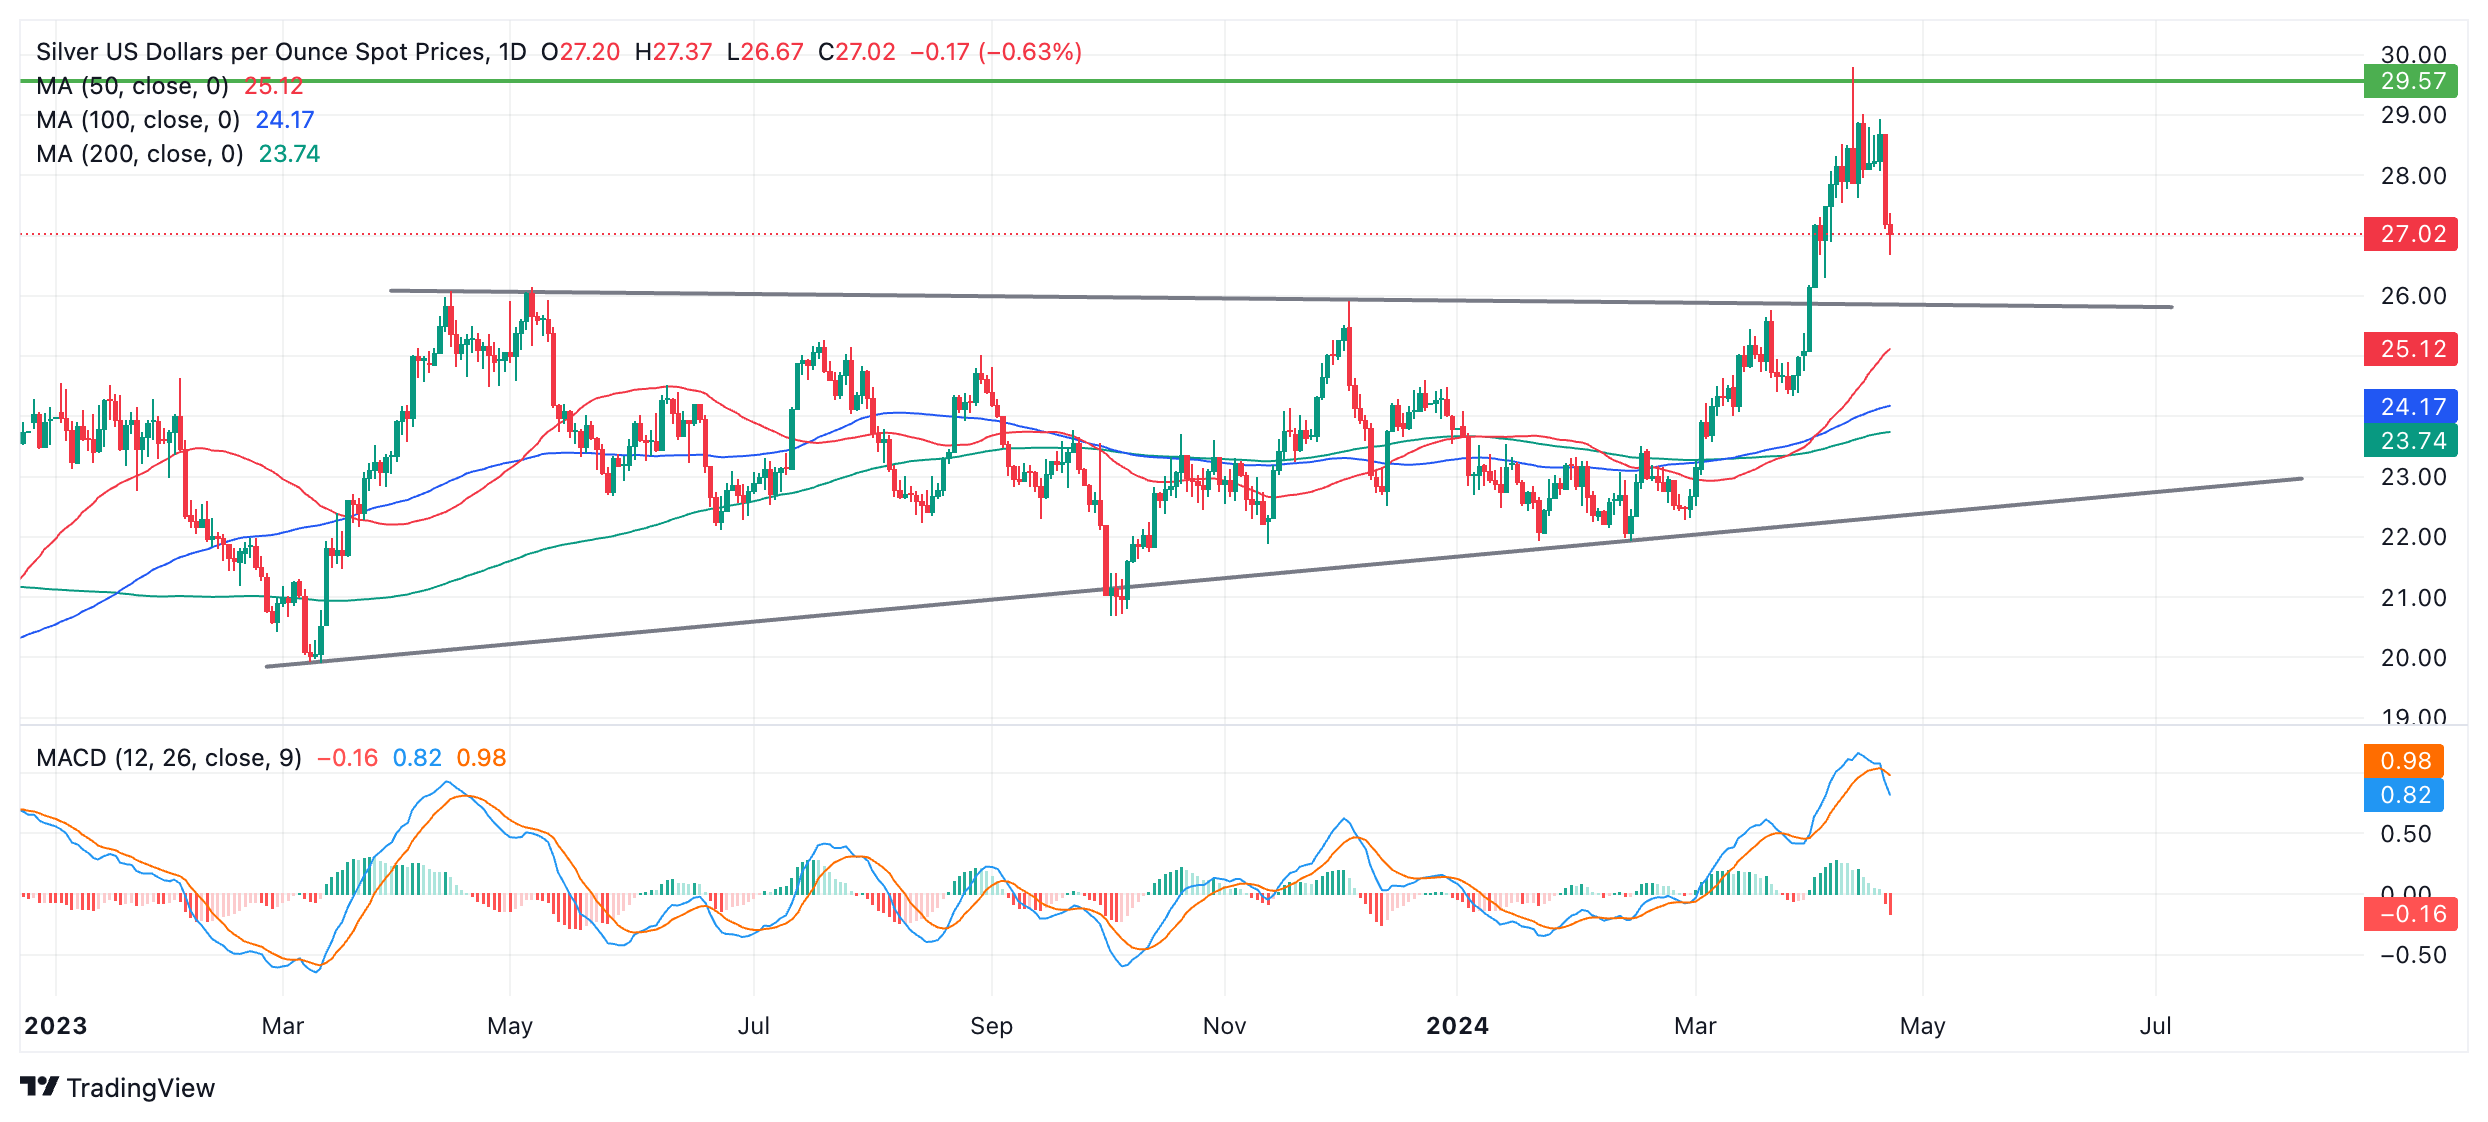
The Moving Average Convergence/Divergence (MACD) momentum indicator has crossed below its signal line, indicating Silver has probably reversed its medium-term trend and is set to move even lower. The signal is improved by the fact that MACD is a more reliable indicator in markets that are not strongly trending such as that of Silver. 

Silver price will probably fall to support from the former range highs at $26.00. At that level it could base and recover. A decisive break below $26.00 would return Silver to inside its year-long range and possibly the lower trendline at roughly $23.00. 

Only a decisive break above the 2021 high of $30.07, however, would reverse the bearish picture and suggest Silver was going higher. Such a move would also signal a breakout from the whole four-year consolidation with an initial target at $32.40 where former resistance lies. 

Author

Joaquin Monfort

Joaquin Monfort is a financial writer and analyst with over 10 years experience writing about financial markets and alt data. He holds a degree in Anthropology from London University and a Diploma in Technical analysis.

More from Joaquin Monfort
Share:

Editor's Picks

EUR/USD seems fragile below 1.1700 as Middle East war boosts energy prices

The EUR/USD pair trades flat at around 1.1680 during the Asian trading session on Tuesday, but broadly seems vulnerable, being close to its five-week low. The major currency pair is under pressure as surging oil prices due to the United States-Israel war with Iran have increased the risks of higher inflation for the Old Continent.

GBP/USD hovers around 1.3400 with bearish pressure intact

GBP/USD edges higher after three days of losses, trading around 1.3400 during the Asian hours on Tuesday. The technical analysis of the daily chart indicates an ongoing bearish bias, as the pair trades within a descending channel pattern.

Gold stays bullish as Iran war continues to spur safe-haven flows

Gold is finding renewed bids in Asian trades on Tuesday, making another attempt to regain the $5,400 level amid persistent demand for safe-haven assets as the Iran war extends. A softer risk tone remains in play as US President Donald Trump continues to threaten deeper escalation to the ongoing war with Iran, warning that a “big wave” is yet to come.

Top Crypto Gainers: Near Protocol, Virtuals Protocol, and Morpho lead market recovery

Near Protocol, Virtuals Protocol, and Morpho are leading the market recovery with double-digit gains over the last 24 hours. Technically, NEAR extends the breakout of the falling channel pattern, VIRTUAL holds above the 50-day EMA, while MORPHO tests a crucial resistance. 

The market is not panicking it is repricing the probability distribution of Oil and time

At the end of the day, markets do not trade morality or geopolitics. They trade transmission channels. And the only channel that truly matters in this maelstrom runs through the price of energy and the time value of money.

Grass 20% bullish breakout defies broader market weakness

Grass (GRASS) is edging up above $0.30 at the time of writing on Monday. The token’s notable 20% intraday surge stands out amid heightened volatility in the broader crypto market.