|

Silver lurches higher as markets wrap up 2023, XAG/USD rebounds from $24.00

  • XAG/USD caught a bounce from $24.00 to retest $24.40.
  • Silver markets are churning as investors weigh Fed rate cut odds.
  • Despite the bullish lean, Silver remains capped below $24.60.

XAG/USD caught a broad-market risk appetite surge on Wednesday as investors continue to lean heavily into bets that the Federal Reserve (Fed) will start cutting interest rates in 2024, with some expecting the first cuts to begin as soon as March of next year.

Silver up on broad-market sentiment shift, but remains weighed down, gains limited

Spot Silver is leaning notably bullish as markets wrap up 2023 with a thin, shortened post-holiday trading week, keeping XAG/USD pinned into a familiar but rough near-term range, caught between $24.00 and $24.60.

US Treasury yields are easing back and the US Dollar is slumping further as investors pile into Fed rate cut bets, with the US 2-year Treasury yield slipping to 4.26% after starting Wednesday near 4.3%. As investors ramp up risk bids on rate cut expectations, the 2-year Treasury yield has fallen to its lowest level since May of this year, but Silver is seeing only limited knock-on bidding from broad-market risk flows.

XAG/USD Technical Outlook

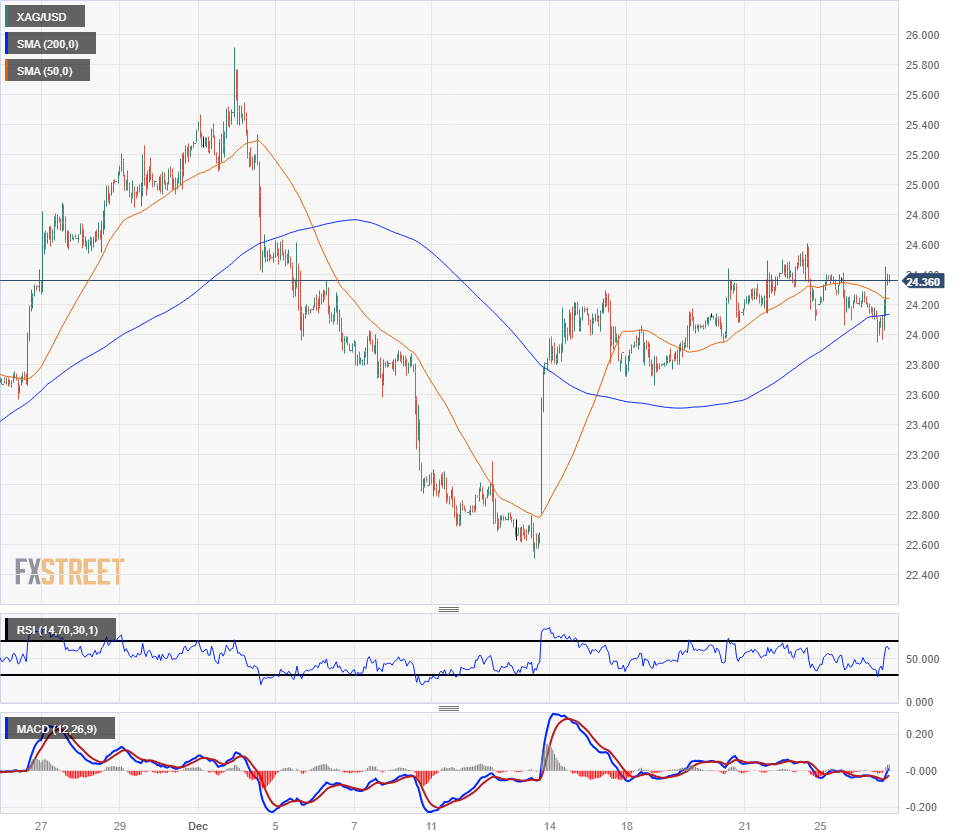
Spot Silver caught a batch of bids back into the $24.40 region after seeing a sloppy bounce from the 200-hour Simple Moving Average (SMA) near $24.10, and XAG/USD is now caught into familiar congestion points that have plagued Spot Silver markets in the near-term.

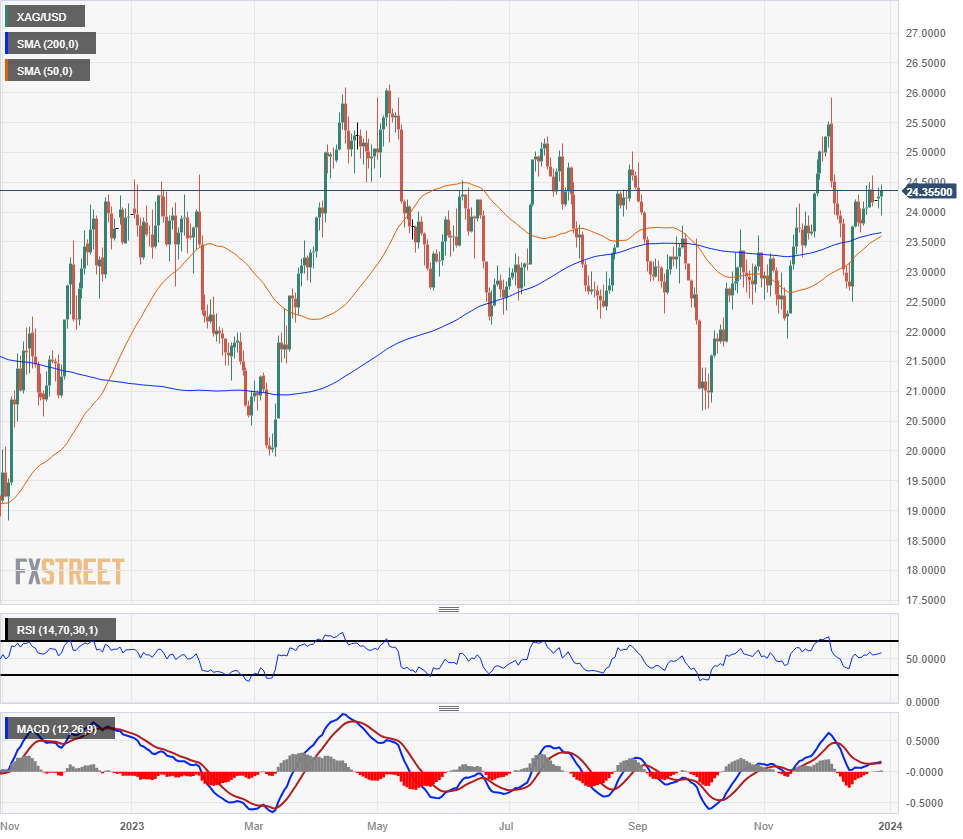
XAG/USD has spent most of the year trapped in a rough cyclical pattern, circling the 200-day SMA near $23.50 as Silver struggles to capitalize meaningfully on broad-market Greenback bearishness.

The outlook heading into 2024 is leaning cautiously bullish as the 50-day SMA gears up for a bullish cross of the 200-day SMA, which could provide technical support for any pullbacks, but topside momentum remains limited and could pose a risk for any overextended long buildups.

XAG/USD Hourly Chart

XAG/USD Daily Chart

XAG/USD Technical Levels

XAG/USD

Overview
Today last price24.36
Today Daily Change0.10
Today Daily Change %0.41
Today daily open24.26
 
Trends
Daily SMA2024.07
Daily SMA5023.57
Daily SMA10023.24
Daily SMA20023.65
 
Levels
Previous Daily High24.42
Previous Daily Low24.06
Previous Weekly High24.61
Previous Weekly Low23.66
Previous Monthly High25.27
Previous Monthly Low21.88
Daily Fibonacci 38.2%24.28
Daily Fibonacci 61.8%24.2
Daily Pivot Point S124.08
Daily Pivot Point S223.89
Daily Pivot Point S323.73
Daily Pivot Point R124.43
Daily Pivot Point R224.6
Daily Pivot Point R324.79

Author

Joshua Gibson

Joshua joins the FXStreet team as an Economics and Finance double major from Vancouver Island University with twelve years' experience as an independent trader focusing on technical analysis.

More from Joshua Gibson
Share:

Markets move fast. We move first.

Orange Juice Newsletter brings you expert driven insights - not headlines. Every day on your inbox.

By subscribing you agree to our Terms and conditions.

Editor's Picks

EUR/USD ticks lower following the release of FOMC Minutes

The US Dollar found some near-term demand following the release of the FOMC meeting minutes, with the EUR/USD pair currently piercing the 1.1750 threshold. The document showed officials are still willing to trim interest rates. Meanwhile, thinned holiday trading keeps major pairs confined to familiar levels.

GBP/USD remains sub- 1.3500, remains in the red

The GBP/USD lost traction early in the American session, maintaining the sour tone and trading around 1.3460 following the release of the FOMC meeting minutes. Trading conditions remain thin ahead of the New Year holiday, limiting the pair's volatility.

Gold stable above $4,350 as the year comes to an end

Gold price got to recover some modest ground on Tuesday, holding on to intraday gains and changing hands at $4,360 a troy ounce in the American afternoon. The bright metal showed no reaction to the release of the FOMC December meeting minutes.

Ethereum: ETH holds above $2,900 despite rising selling activity

Ethereum (ETH) held the $2,900 level despite seeing increased selling pressure over the past week. The Exchange Netflow metric showed deposits outweighed withdrawals by about 400K ETH. The high value suggests rising selling activity amid the holiday season.

Economic outlook 2026-2027 in advanced countries: Solidity test

After a year marked by global economic resilience and ending on a note of optimism, 2026 looks promising and could be a year of solid economic performance. In our baseline scenario, we expect most of the supportive factors at work in 2025 to continue to play a role in 2026.

Crypto market outlook for 2026

Year 2025 was volatile, as crypto often is.  Among positive catalysts were favourable regulatory changes in the U.S., rise of Digital Asset Treasuries (DAT), adoption of AI and tokenization of Real-World-Assets (RWA).