Silver could shoot for the moon if it can free itself from its range
- Silver has been trapped in a range since the start of 2023.
- A list of bullish fundamental factors are gathering, however, suggesting more upside for Silver.
- A decisive break above $26.00 would provide confirmation of a bullish turn.

Silver (XAG/USD) has been trapped in a range between $20 and $26 over the last year, but the precious metal’s fundamentals look bright for 2024, suggesting it could break out, according to experts.
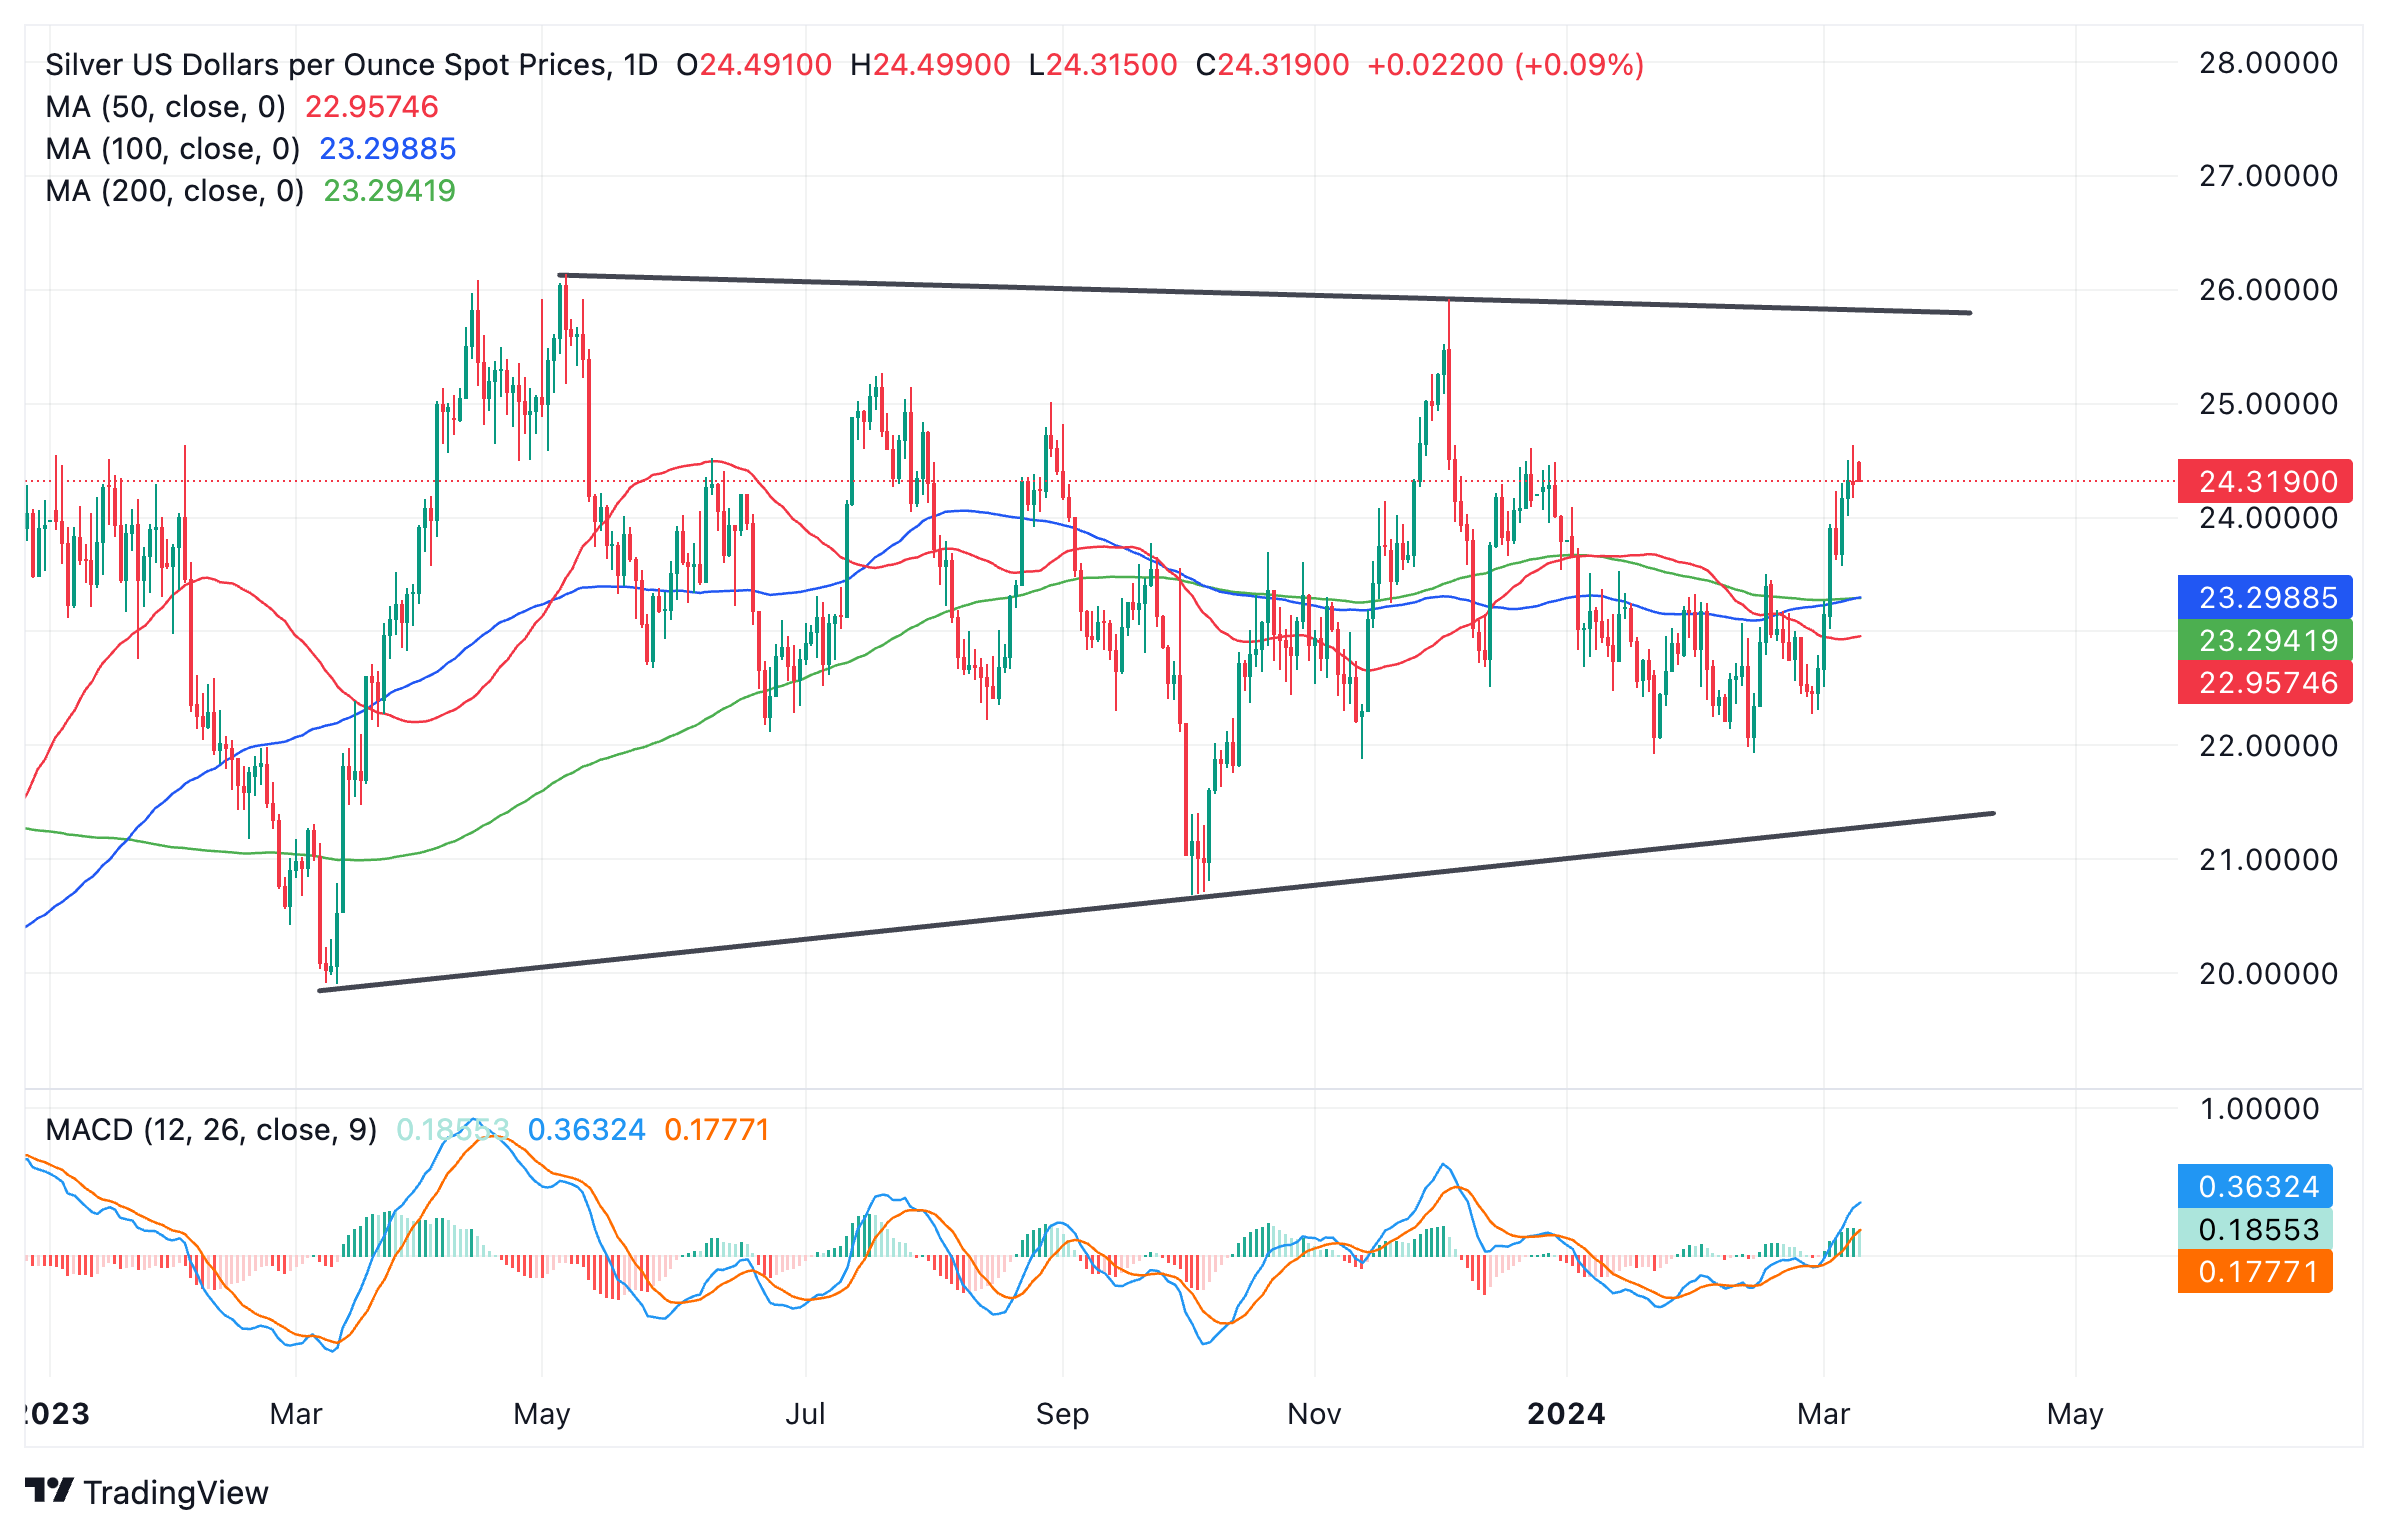
Silver versus US Dollar: daily chart
Silver is both a precious metal, bought because it retains its value like Gold, but also because it is used in a wide variety of industrial processes, including the manufacture of automobiles, solar panels and electronics. It is, therefore, sensitive to both global growth prospects and to changes in interest rates and inflation. This special combination of influences suggests Silver could be in a sweet spot from a fundamental perspective.
Silver to rise on global growth prospects
XAG/USD should push higher in the third and fourth quarters of 2024 because rising growth will see increased demand for the metal from industry, according to Marcus Garvey, a commodities analyst at Macquarie Group.
“As a dual precious and industrial metal, if we start to see global growth pick up a bit more over the course of this year — which is very much our base case — then I would expect Silver to go from a relative underperformer to Gold to being a relative outperformer to gold over really the third and fourth quarter of this year.” Garvey said in an Interview with CNBC news.
Riding on the coat-tails of Gold
Silver’s traditional role as a store of value, however, also means it should benefit from expectations that the Federal Reserve (Fed) will start to cut interest rates this year.
Lower interest rates mean precious metals and non-yielding assets in general – such as Bitcoin – gain in value. This is because the opportunity cost of owning them falls, which means holders stand to lose less money compared to parking their money as cash or in yielding assets such as bonds.
This is the main reason behind Gold’s recent ascent to an all-time high in the $2,190s.
It could mean Silver is about to start its own surge, according to some experts who hold that Silver usually follows Gold, only after a lag.
In addition, because Silver is primarily priced in US Dollars, a weaker USD tends to propel Silver higher. Lower interest rates tend to negatively impact the Dollar as they lead to less foreign capital inflows, and this could further support Silver prices going forward.
Heightened demand
Demand for Silver is likely to hit record levels in 2024, according to the Silver Institute, a not-for-profit association, further acting as a bullish driver on prices.
In a report published earlier in the year, the Institute said global Silver demand was forecast to reach 1.2 billion ounces in 2024, hitting its second-highest level on record.
When to buy?
What sort of technical confirmation can investors expect before pressing the “buy” button on Silver? To answer this question we return to the chart, which shows the top of Silver’s long-term range located at $26.00 an ounce. It would, therefore, take a decisive break above this level to confirm a breakout from the precious metal’s current straight jacket and see it rally higher.
The usual technical method for predicting the extent of breakouts from ranges is to take the height of the range and extrapolate it higher from the breakout point. Such a method would indicate a target for Silver at just shy of $32.00, however, a more conservative estimate would indicate a target in the $29.50s, the 61.8% Fibonacci extrapolation of the range.
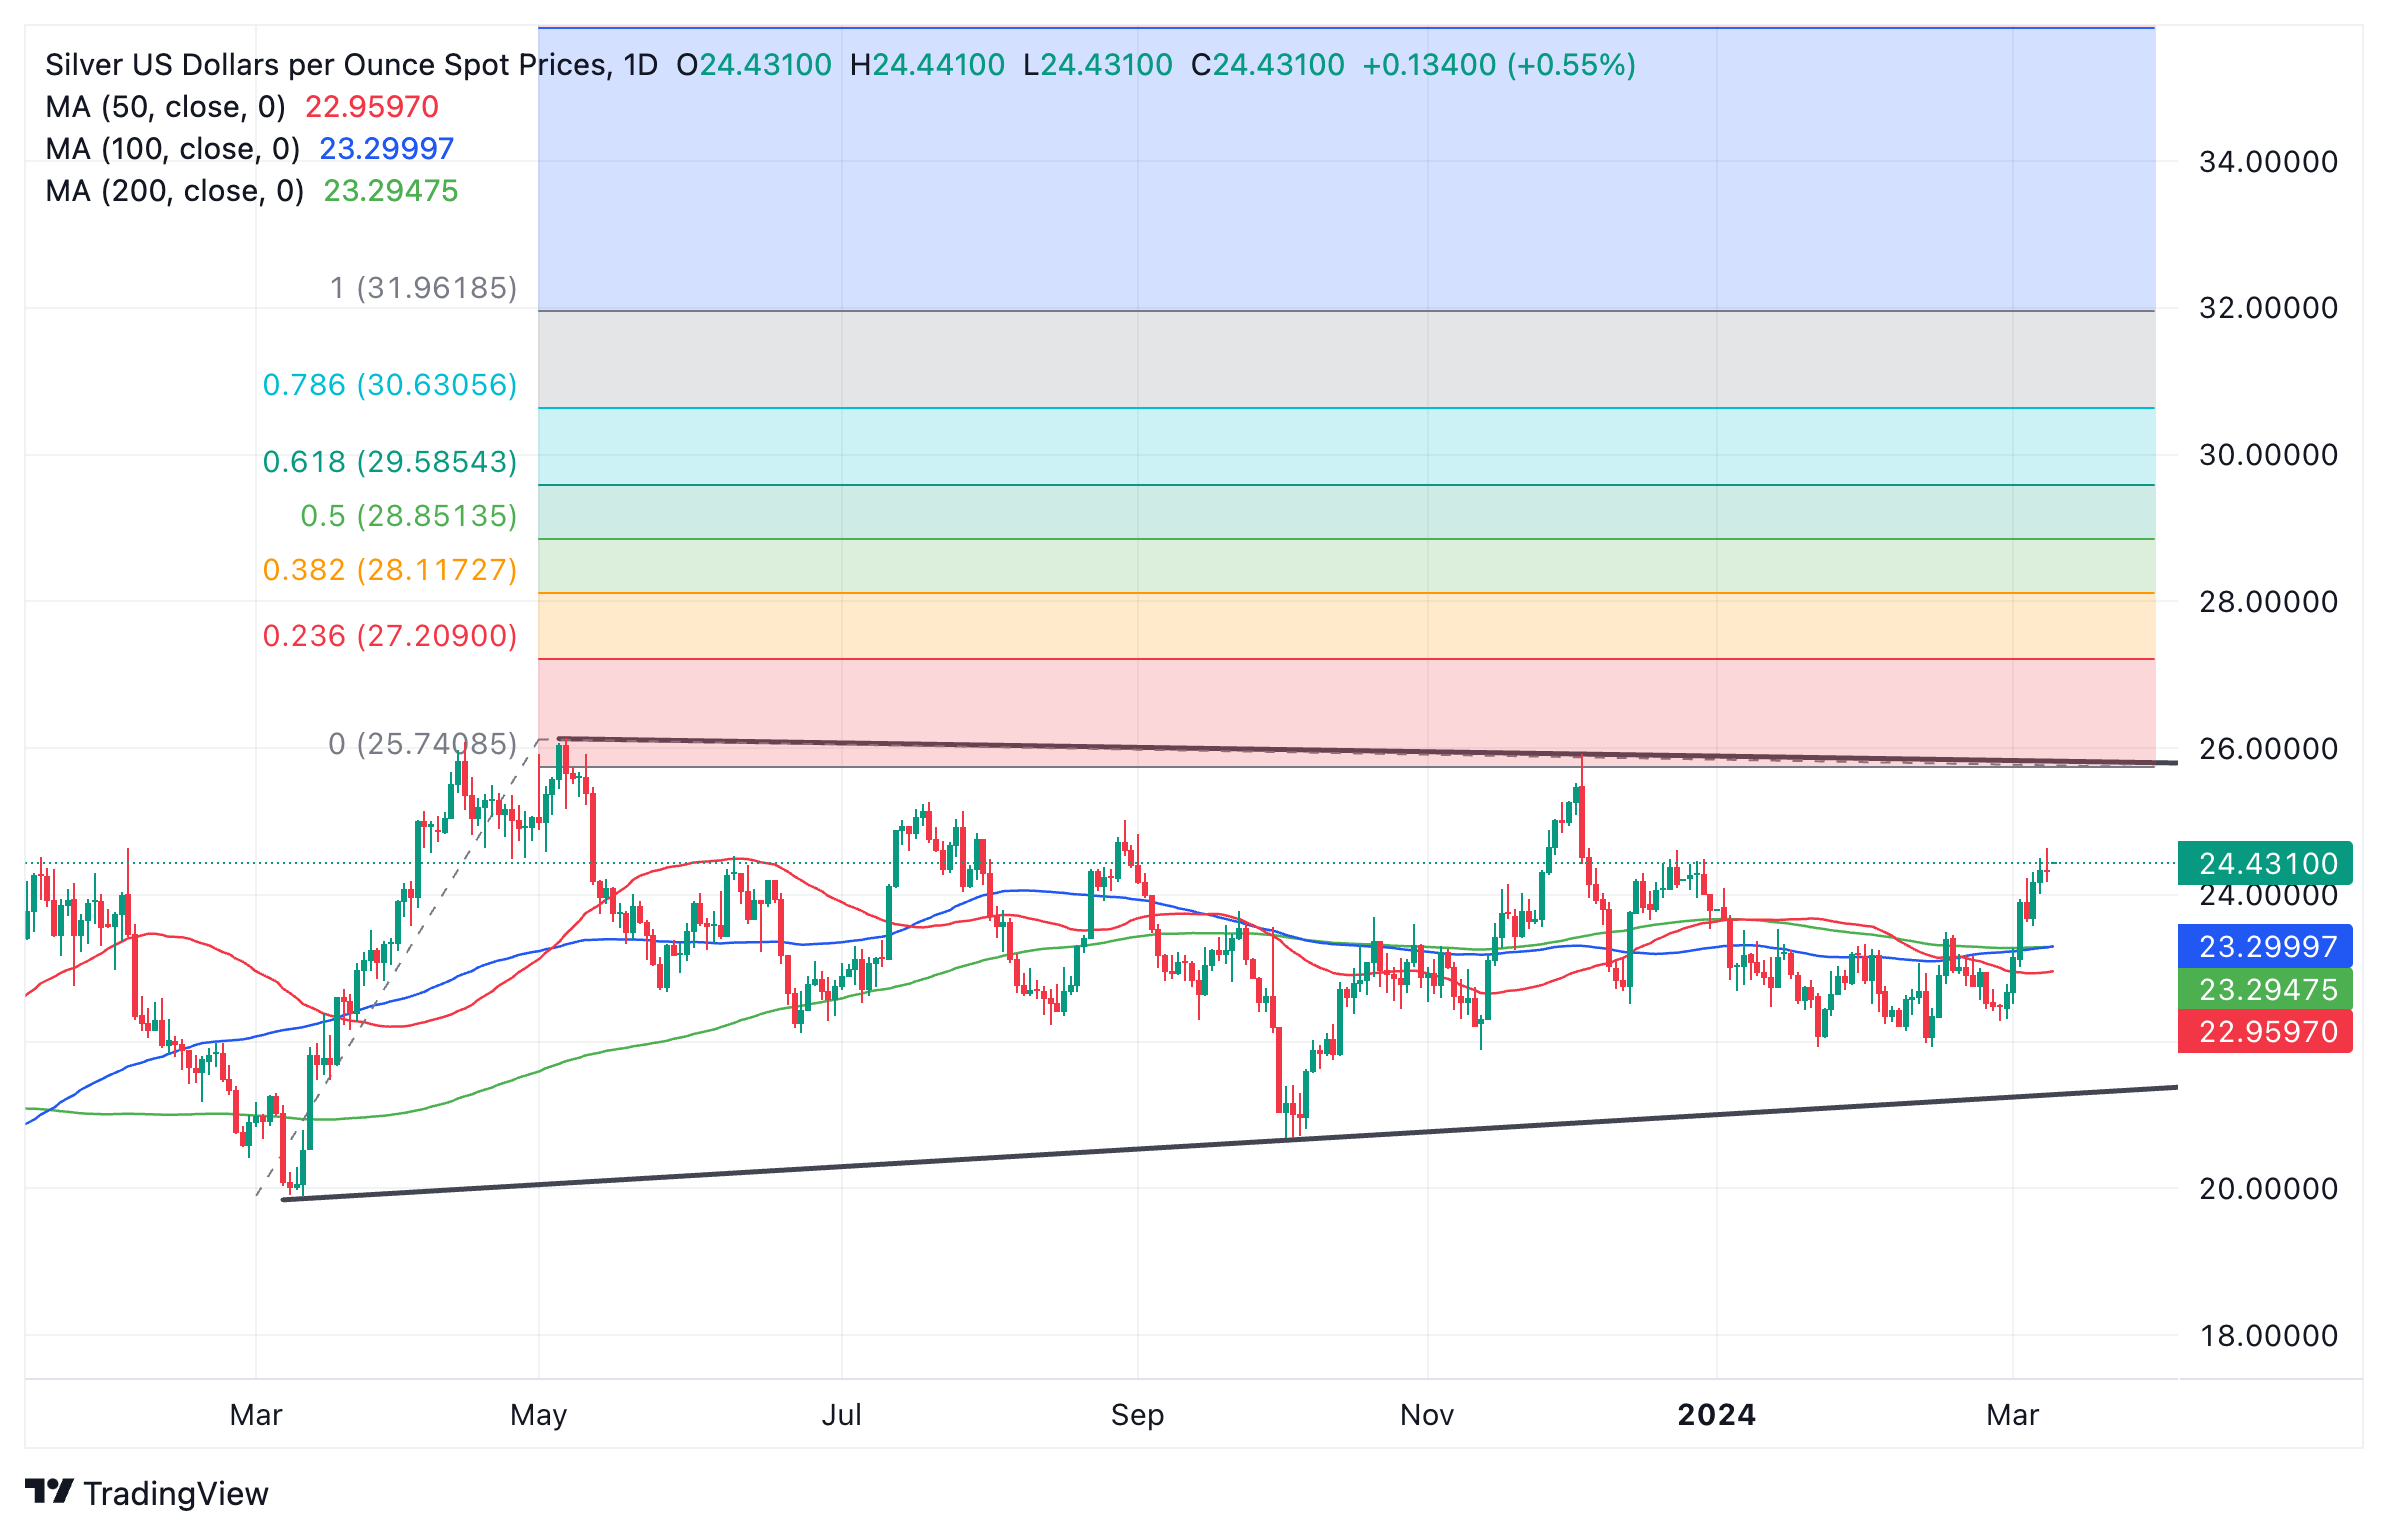
Silver versus US Dollar: daily chart
In order to avoid being caught in a “fake out”, investors should make sure the break above $26.00 is decisive before diving in. This means it should be accompanied by a longer-than-average daily bullish bar which closes near its high, or three up days that pierce cleanly above the resistance level.
Author

Joaquin Monfort
FXStreet
Joaquin Monfort is a financial writer and analyst with over 10 years experience writing about financial markets and alt data. He holds a degree in Anthropology from London University and a Diploma in Technical analysis.


