$RRC: Gas producer range resources starting next bullish cycle
Range Resources is a U.S. American corporation that has its headquarters in Fort Worth, Texas, USA. Founded in 1976 and traded under tickers $RRC at NYSE, it is a component of the S&P 400 index. Range Resources is the 7th largest U.S. producer of natural gas and possesses reserves in the Appalachian Basin, the Barnett Shale in Texas, and the Marcellus Shale in Pennsylvania. The company has been investing in new technologies to shape new standards for shale development. This includes their commitment to sustainable operations and emission-reducing technologies. Currently, we can see natural gas turning higher after years of depressed prices. Therefore, Range Resources being a pure player in that awakening commodity should become a good opportunity for investors to participate in the anticipated rally in natural gas prices.
Range resources monthly Elliott Wave analysis 08.09.2023

The monthly chart below shows the Range Resources shares $RRC traded at New York Stock Exchange. From the all-time lows, the stock price is showing a nesting price action. Firstly, initial impulse in black wave ((I)) of grand super cycle degree has ended in April 2014 by printing the all-time highs at $95.41. Hereby, blue wave (III) shows an extension and blue wave (IV) a converging Elliott wave triangle structure. From $95.41 highs, a consolidation in black wave ((II)) as a double three pattern has set an important bottom in March 2020 at 1.61 lows. Secondly, from the March 2020 lows, new cycle in black wave ((III)) has started. Within it, $RRC price action has formed an intial nest in red waves I-II. Currently, red wave III is in progress and should extend higher. Hereby, target for red wave III is 58.35-80.49 area and even higher. In the long-term, target for black wave ((III)) is 97.03-156.06 area and beyond.
Range resources daily Elliott Wave analysis 08.09.2023
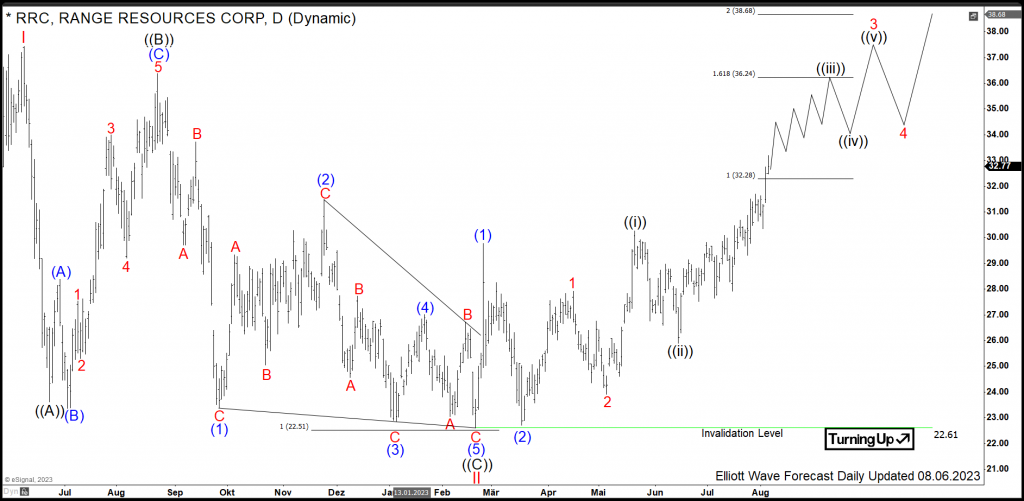
The Daily chart beow shows the consolidation in red wave II from the peak of wave I and first stages of the red wave III in more detail. Firstly, red wave II has unfolded as a zigzag pattern being 5-3-5 structure. From June 2022 highs at $37.44, the initial drop in black wave ((A)) has printed a low the same month at $23.61. Then, bounce in black wave ((B)) has set a connector in August 2022 at $36.68. From there, black wave ((C)) demonstrates an Elliott wave ending diagonal pattern being 3-3-3-3-3 structure. When comparing black waves ((A)) and ((C)), typically, 3rd swing reaches at least 100% extension of the thirst swing being $22.51 level. One can see that $RRC has missed that level and has turned higher.
It is the preferred view, that red wave II has ended in February 2023 at $22.61 lows. While above there, red wave III might be in progress. As a matter of fact, $RRC should break $37.44 highs to confirm wave III and rule out a double correction in red wave II. In shorter cycles, one can see 3 nests from February 2023. Right now, acceleration higher within black wave ((iii)) is taking place. Using Fibonacci extenisons, it can reach higher within 32.28-36.24 area and even beyond. Investors and traders should be waiting the black wave ((1)) to break above $37.44 first. Only then, they can buy $RRC in a pullback as black wave ((2)) against $22.61 lows in 3, 7 swings.
Premium
You have reached your limit of 3 free articles for this month.
Start your subscription and get access to all our original articles.
Author

Elliott Wave Forecast Team
ElliottWave-Forecast.com


