|

Pan American Silver (PAAS): Pullback nearing end, upside potential ahead

Pan American Silver Corp. (PAAS) is a mining company based in Vancouver, Canada, focused on silver, gold, zinc, lead, and copper. Founded in 1979, it handles exploration, development, extraction, processing, and refining. The company operates in Canada, Mexico, Peru, Bolivia, Argentina, Chile, and Brazil. Below we will take a look at the Elliott Wave technical outlook.

PAAS monthly Elliott Wave chart

Chart

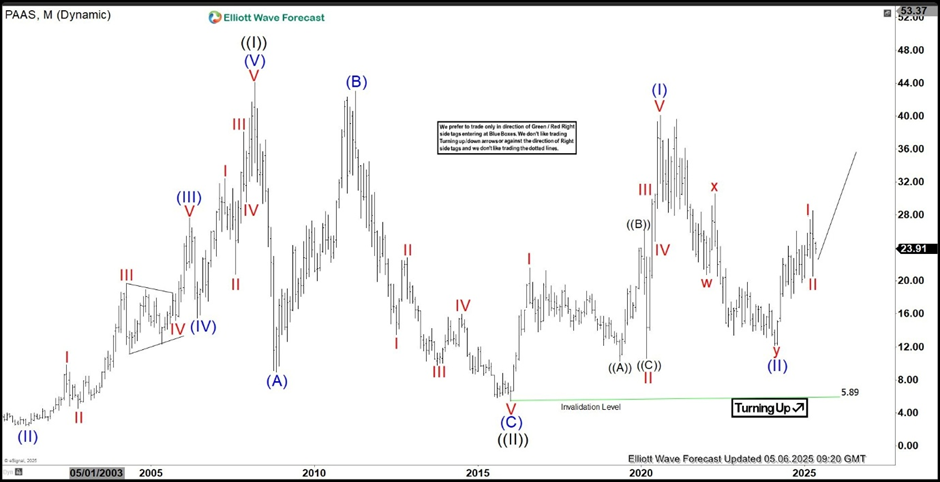
The monthly Elliott Wave chart for Pan American Silver (PAAS) indicates that the wave ((II)) pullback concluded at $5.89 in January 2016. Since then, the stock has begun advancing in wave ((III)). From the wave ((II)) low, wave (I) peaked at $40.11, followed by a wave (II) pullback that bottomed at $12.16. The stock has now resumed its upward trend in wave (III). Within this wave, wave I reached $28.60, with a subsequent wave II pullback ending at $20.55. As long as the $5.89 low holds, the stock is expected to continue rising.

PAAS daily Elliott Wave chart

Chart

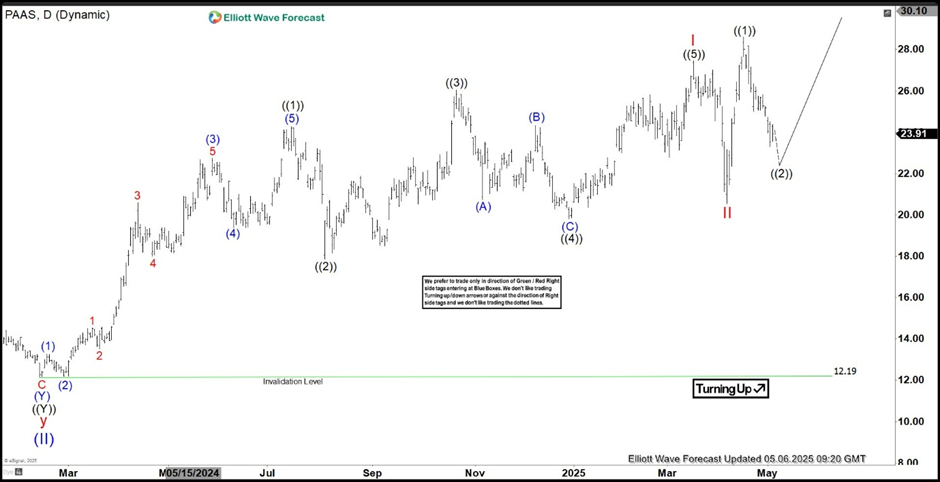
The daily Elliott Wave chart for Pan American Silver (PAAS) indicates that the wave (II) pullback concluded at $12.19. From this low, the stock began an upward move in wave I, structured as a diagonal pattern. Within wave I, wave ((1)) peaked at $24.27, followed by a wave ((2)) pullback to $17.86. The stock then climbed in wave ((3)) to $26.05, with a wave ((4)) dip ending at $19.80. The final wave ((5)) completed wave I at $27.47. A subsequent wave II pullback ended at $20.55. As long as the $12.19 low remains intact, the stock is expected to continue rising.

Author

Elliott Wave Forecast Team

Elliott Wave Forecast Team

ElliottWave-Forecast.com

More from Elliott Wave Forecast Team
Share:

Editor's Picks

EUR/USD deflates to fresh lows, targets 1.1600

The selling pressure on EUR/USD now gathers extra pace, prompting the pair to hit fresh multi-week lows in the 1.1625-1.1620 band on Friday. The continuation of the downward bias comes in response to further gains in the US Dollar as market participants continue to assess the mixed release of US Nonfarm Payrolls in December.

GBP/USD breaks below 1.3400, challenges the 200-day SMA

GBP/USD remains under heavy fire and retreats for the fourth consecutive day on Friday. Indeed, Cable suffers the strong performance of the Greenback, intensified post-mixed NFP, and trades at shouting distance from its critical 200-day SMA near 1.3380.

Gold flirts with yearly tops around $4,500

Gold keeps its positive bias on Friday, adding to Thursday’s advance and challenging yearly highs in the $4,500 region per troy ounce. The risk-off sentiment favours the yellow metal despite the firmer tone in the Greenback and rising US Treasury yields.

Crypto Today: Bitcoin, Ethereum, XRP risk further decline as market fear persists amid slowing demand

Bitcoin holds $90,000 but stays below the 50-day EMA as institutional demand wanes. Ethereum steadies above $3,000 but remains structurally weak due to ETF outflows. XRP ETFs resume inflows, but the price struggles to gain ground above key support.

Week ahead – US CPI might challenge the geopolitics-boosted Dollar

Geopolitics may try to steal the limelight from US data. A possible US Supreme Court ruling on tariffs could dictate market movements. A crammed data calendar next week, US CPI comes on Tuesday; Fedspeak to intensify.

XRP trades under pressure amid weak retail demand

XRP presses down on the 50-day EMA support as risk-averse sentiment spreads despite a positive start to 2026. XRP faces declining retail demand, as reflected in futures Open Interest, which has fallen to $4.15 billion.