|

Oil Asia Price Forecast: WTI agonising in multi-year lows, trades near $20 a barrel

  • WTI is suffering one of its largest selloffs in history plummeting to $20 a barrel in a matter of weeks.
  • WTI remains under heavy selling pressure as March is coming to an end.
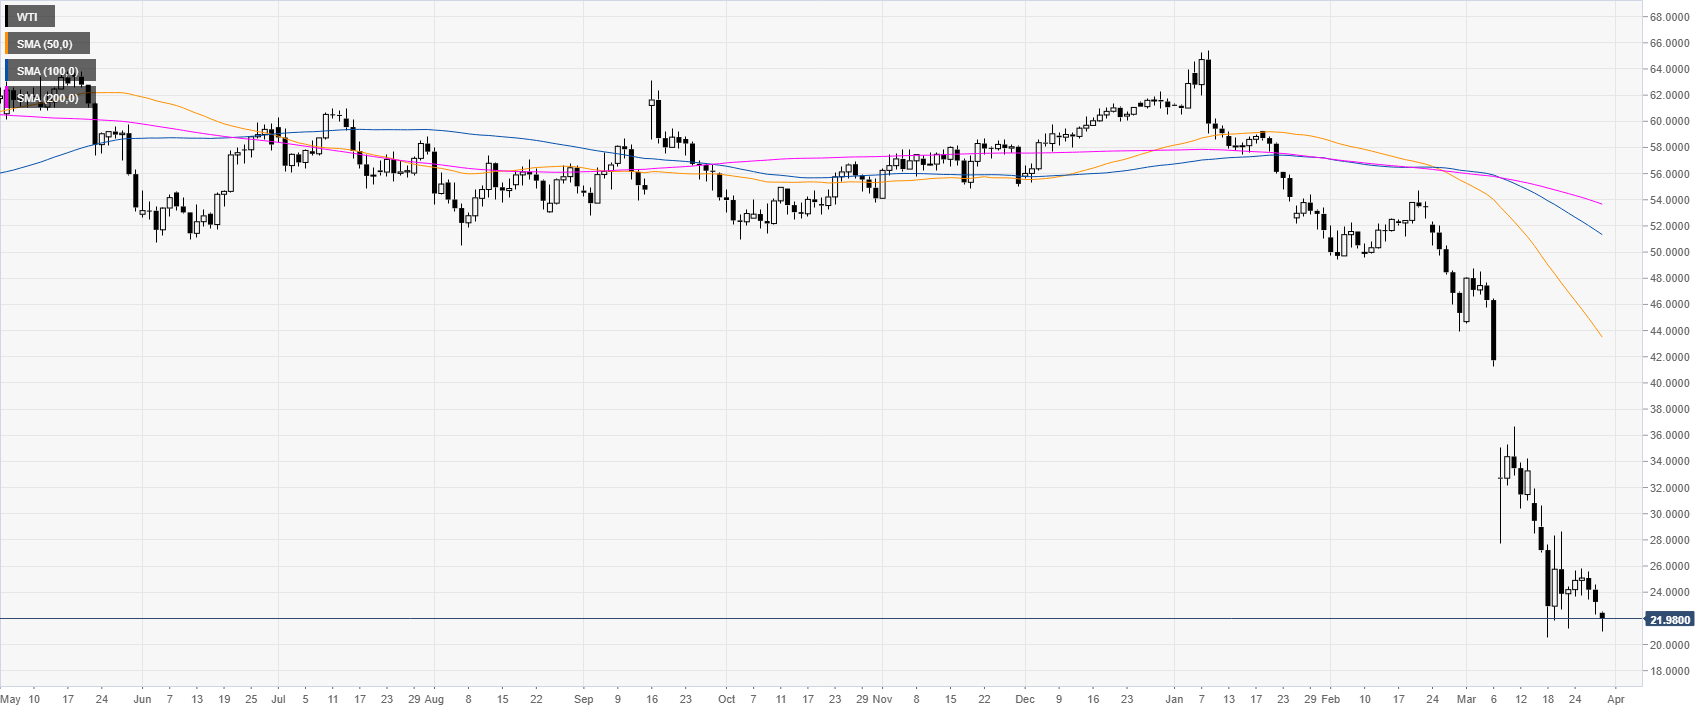


Oil daily chart

 
WTI collapsed sharply in the last two months of trading as WTI is agonising near its lowest level since February 2002, near $20 per barrel. 
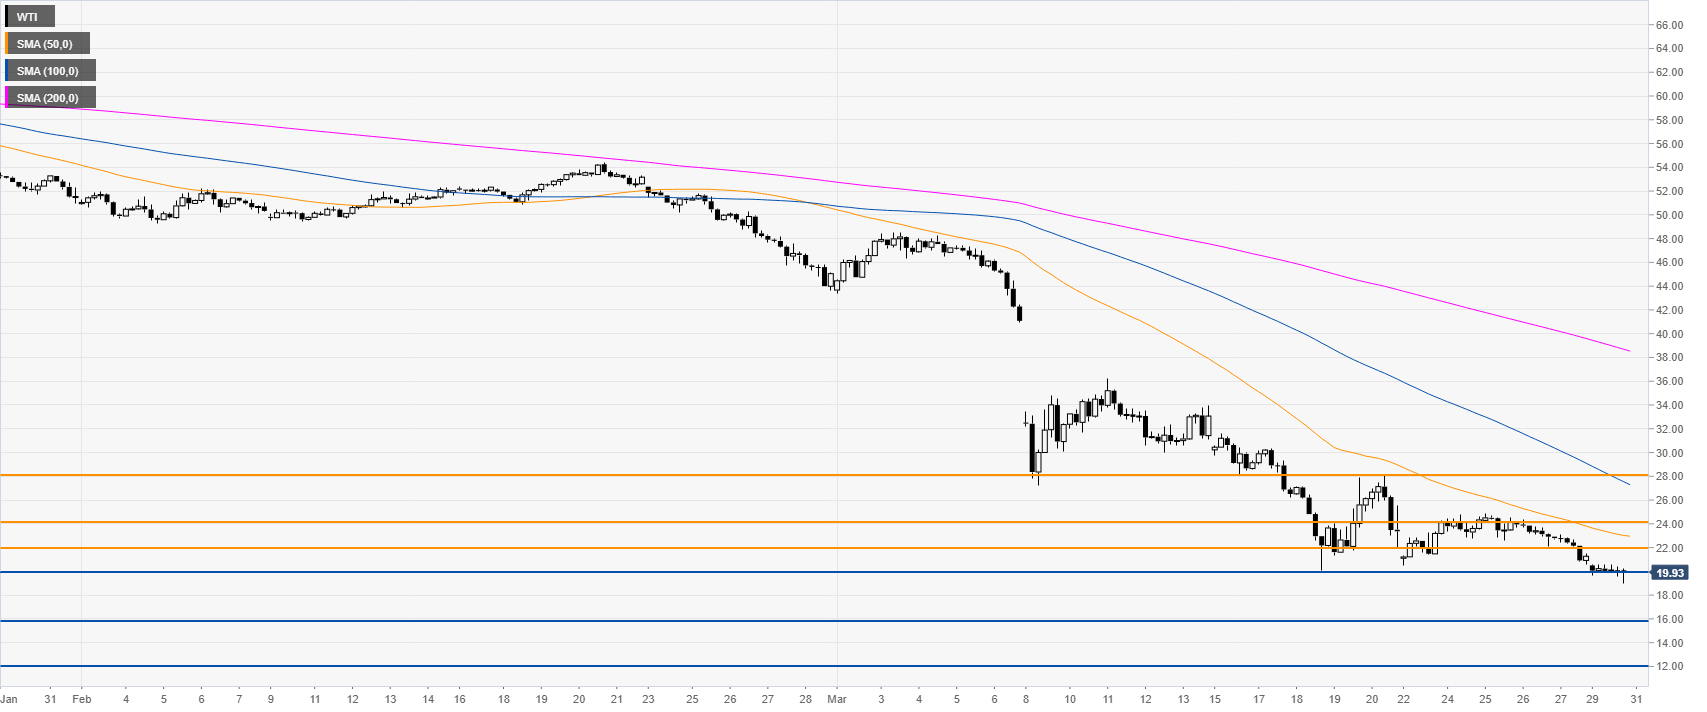
 

Oil four-hour chart

 
The oil market remains under heavy selling pressure below the main SMAs as bears are looking to extend the selloff below the 20 level which could introduce scope to the 16 and 12 levels on the way down. On the flip side, buyers would need to gather strength at least above the 28 resistance but they need to overcome the 22 and 24 resistance on the way up.
 

Additional key levels

WTI

Overview
Today last price22.01
Today Daily Change-1.25
Today Daily Change %-5.37
Today daily open23.26
 
Trends
Daily SMA2032.2
Daily SMA5044.15
Daily SMA10051.58
Daily SMA20053.82
 
Levels
Previous Daily High24.56
Previous Daily Low22.33
Previous Weekly High25.85
Previous Weekly Low21.19
Previous Monthly High54.69
Previous Monthly Low43.95
Daily Fibonacci 38.2%23.18
Daily Fibonacci 61.8%23.71
Daily Pivot Point S122.21
Daily Pivot Point S221.16
Daily Pivot Point S319.98
Daily Pivot Point R124.43
Daily Pivot Point R225.61
Daily Pivot Point R326.66

Author

Flavio Tosti

Flavio Tosti

Independent Analyst


More from Flavio Tosti
Share:

Markets move fast. We move first.

Orange Juice Newsletter brings you expert driven insights - not headlines. Every day on your inbox.

By subscribing you agree to our Terms and conditions.

Editor's Picks

EUR/USD faces the next support around 1.1600

EUR/USD comes under pressure and retreats for the fourth day in a row on Tuesday, coming closer to the key 1.1600 neighbourhood amid a decent rebound in the US Dollar ahead of the largely expected 25 basis point rate cut by the Federal Reserve on Wednesday.

GBP/USD extends mean reversion as investors brace for Fed

GBP/USD eased back toward the midrange on Tuesday, shedding around one-fifth of one percent after facing an intraday technical rejection from the 1.3350 level. Price action has slumped back into the 1.3300 handle and is holding just north of the long-term 200-day Exponential Moving Average near 1.3250 as markets hunker down for the last Federal Reserve (Fed) interest rate decision of 2025.

Gold comfortable above $4,200

Gold is still holding a positive tone around the $4,200 zone per troy ounce on Tuesday, though it’s starting to lose a bit of steam as the US Dollar finds support from stronger-than-expected jobs data. Even so, markets remain confident the Fed will move ahead with a rate cut on Wednesday, which ultimately lends support to the yellow metal.

Ethereum: Whales accumulate ETH ahead of Fed meeting

Ethereum is up 6% on Tuesday following increased whale buying activity and President Donald Trump's remarks concerning the next Federal Reserve Chair.

Global economic outlook 2026: Financial system risk, trade, public debt

The global and European economies have been resilient in recent years even accounting for the modest global slowdown of 2025. But risks for the recovery are rising, underscoring a negative medium-run global macro and credit outlook.

Crypto Today: Bitcoin, Ethereum, XRP trade under pressure amid mixed technical signals 

Bitcoin is trading above $90,000 at the time of writing on Tuesday amid sticky risk-off sentiment in the broader crypto market. Altcoins, including Ethereum and Ripple, are paring losses, holding above key support levels.