- The NZD/USD pair is currently trading at 0.6852, down 0.45 percent from Friday's high of 0.6883, and could witness a deeper pullback to ascending (bullish) 5-day EMA of 0.6822, as the 4-hour chart is showing a bearish divergence of the relative strength index.
- The pullback could be short-lived as the both 5- and 10-day EMAs are trending north, indicating a bullish setup.
- A daily close below the ascending 10-day EMA would invalidate the bullish setup, allowing a short-term consolidation.
4-hour chart
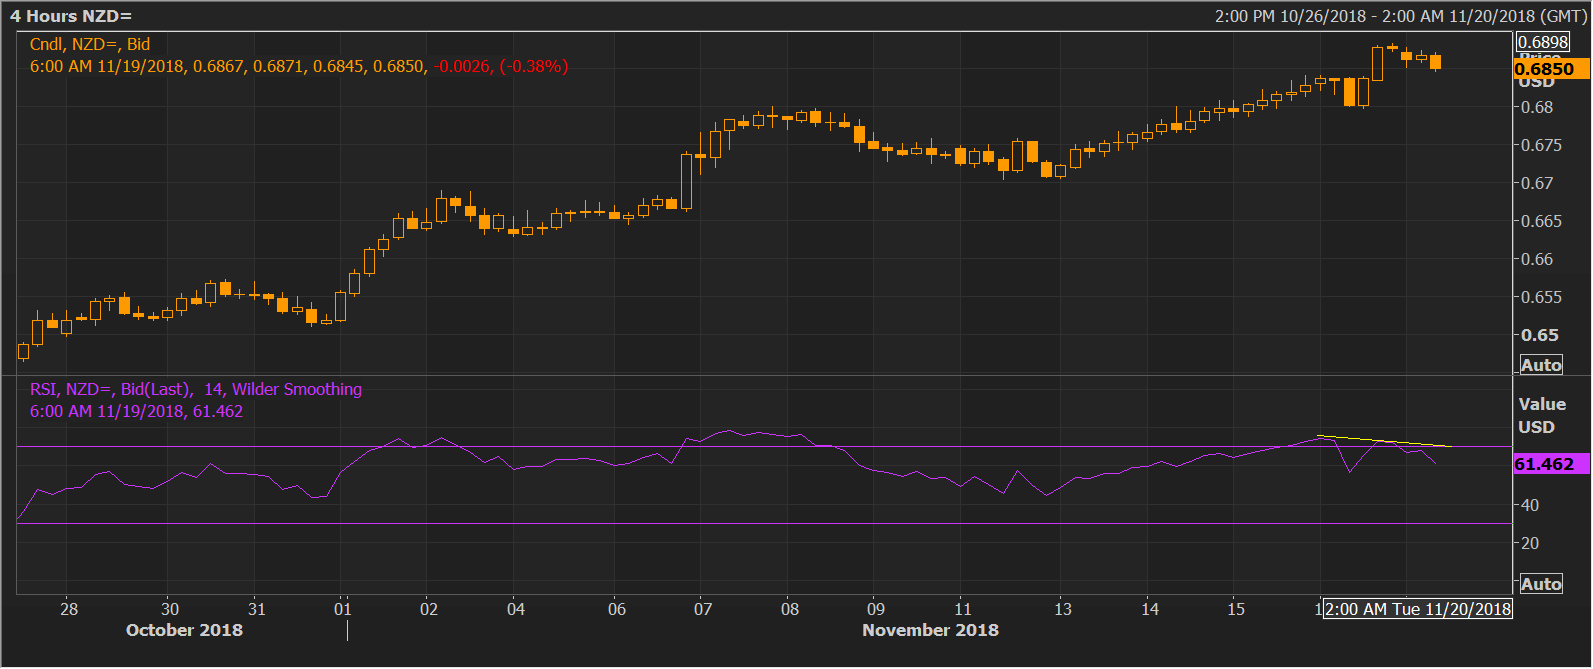
Trend: Pullback likely
NZD/USD
Overview:
Last Price: 0.6854
Daily change: -27 pips
Daily change: -0.392%
Daily Open: 0.6881
Trends:
Daily SMA20: 0.6658
Daily SMA50: 0.6601
Daily SMA100: 0.6657
Daily SMA200: 0.6892
Levels:
Daily High: 0.6884
Daily Low: 0.6798
Weekly High: 0.6884
Weekly Low: 0.6706
Monthly High: 0.663
Monthly Low: 0.6424
Daily Fibonacci 38.2%: 0.6851
Daily Fibonacci 61.8%: 0.6831
Daily Pivot Point S1: 0.6825
Daily Pivot Point S2: 0.6769
Daily Pivot Point S3: 0.674
Daily Pivot Point R1: 0.6911
Daily Pivot Point R2: 0.694
Daily Pivot Point R3: 0.6996
Information on these pages contains forward-looking statements that involve risks and uncertainties. Markets and instruments profiled on this page are for informational purposes only and should not in any way come across as a recommendation to buy or sell in these assets. You should do your own thorough research before making any investment decisions. FXStreet does not in any way guarantee that this information is free from mistakes, errors, or material misstatements. It also does not guarantee that this information is of a timely nature. Investing in Open Markets involves a great deal of risk, including the loss of all or a portion of your investment, as well as emotional distress. All risks, losses and costs associated with investing, including total loss of principal, are your responsibility. The views and opinions expressed in this article are those of the authors and do not necessarily reflect the official policy or position of FXStreet nor its advertisers. The author will not be held responsible for information that is found at the end of links posted on this page.
If not otherwise explicitly mentioned in the body of the article, at the time of writing, the author has no position in any stock mentioned in this article and no business relationship with any company mentioned. The author has not received compensation for writing this article, other than from FXStreet.
FXStreet and the author do not provide personalized recommendations. The author makes no representations as to the accuracy, completeness, or suitability of this information. FXStreet and the author will not be liable for any errors, omissions or any losses, injuries or damages arising from this information and its display or use. Errors and omissions excepted.
The author and FXStreet are not registered investment advisors and nothing in this article is intended to be investment advice.
Recommended content
Editors’ Picks
USD/JPY jumps above 156.00 on BoJ's steady policy

USD/JPY has come under intense buying pressure, surging past 156.00 after the Bank of Japan kept the key rate unchanged but tweaked its policy statement. The BoJ maintained its fiscal year 2024 and 2025 core inflation forecasts, disappointing the Japanese Yen buyers.
AUD/USD consolidates gains above 0.6500 after Australian PPI data

AUD/USD is consolidating gains above 0.6500 in Asian trading on Friday. The pair capitalizes on an annual increase in Australian PPI data. Meanwhile, a softer US Dollar and improving market mood also underpin the Aussie ahead of the US PCE inflation data.
Gold price flatlines as traders look to US PCE Price Index for some meaningful impetus

Gold price lacks any firm intraday direction and is influenced by a combination of diverging forces. The weaker US GDP print and a rise in US inflation benefit the metal amid subdued USD demand. Hawkish Fed expectations cap the upside as traders await the release of the US PCE Price Index.
Sei Price Prediction: SEI is in the zone of interest after a 10% leap

Sei price has been in recovery mode for almost ten days now, following a fall of almost 65% beginning in mid-March. While the SEI bulls continue to show strength, the uptrend could prove premature as massive bearish sentiment hovers above the altcoin’s price.
US economy: Slower growth with stronger inflation

The US Dollar strengthened, and stocks fell after statistical data from the US. The focus was on the preliminary estimate of GDP for the first quarter. Annualised quarterly growth came in at just 1.6%, down from the 2.5% and 3.4% previously forecast.