|

NZD/USD slips below 0.6000 as risk appetite crumples

  • The NZD/USD has dropped back beneath 0.6000 as markets turn back into the US Dollar.
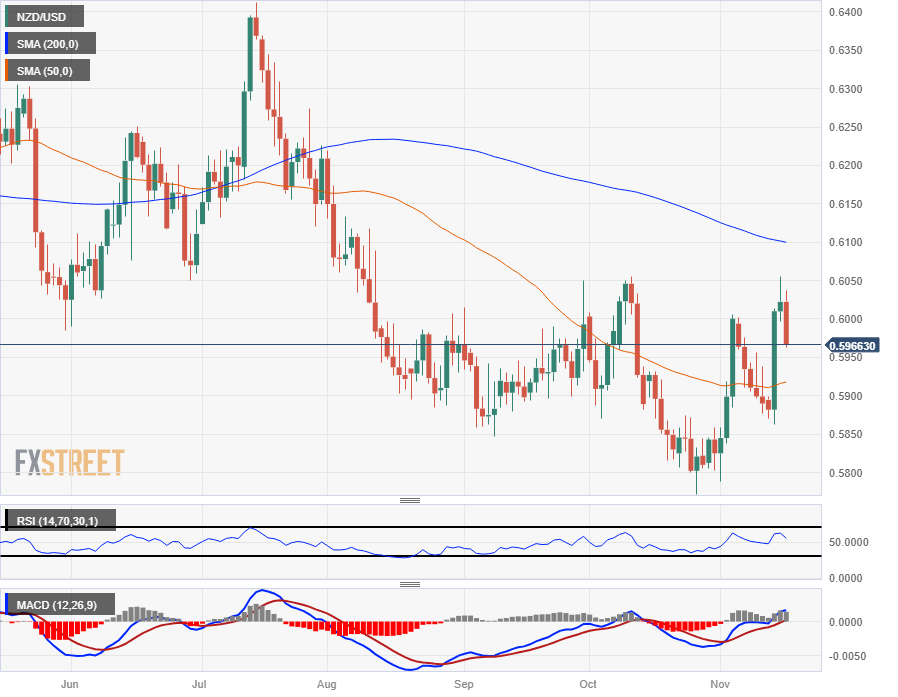
  • The Kiwi's recovery pattern is beginning to calcify into consolidation.
  • NZ PPI to close out the Kiwi's data for the week, US Housing Starts in the barrel for Friday.

The NZD/USD is slipping back on Thursday and is set for its worst trading day in a month, down over 1.2% from the day's high of 0.6037.

A broad miss for US economic data soured market risk appetite, pushing the US Dollar (USD) higher against riskier assets like the Kiwi (NZD). US Initial Jobless Claims for the week into November 10th increased to 231K, higher than the 220K expectation and stepping over the previous week's 218K showing (revised upwards from 217K).

US Industrial Production also missed the mark, with October's production declining by 0.6%, falling back from September's meager 0.1% growth (revised downward from 0.3%) and blowing right past the market's forecast of -0.3%.

New Zealand's Producer Price Index (PPI) will land in the early Friday session when NZ markets open ahead of the pack. NZ PPI in the third quarter last came in at -0.2% for Input and 0.2% for Output.

NZD/USD Technical Outlook

The Kiwi's pullback below the 0.6000 handle leaves the NZD/USD exposed to further downside, with the pair at risk of getting pulled back through the 50-day Simple Moving Average (SMA) and into the 0.5900 handle, with the last swing low sitting near 0.5860.

On the topside, This week's peak at 0.6050 represents a technical resistance level due to repeated rejections from the region since falling into the sub-0.6100 zone in August. Long-term technical resistance will be capping off any upside runs at the 200-day SMA near 0.6100.

NZD/USD Daily Chart

NZD/USD Technical Levels

NZD/USD

Overview
Today last price0.5966
Today Daily Change-0.0056
Today Daily Change %-0.93
Today daily open0.6022
 
Trends
Daily SMA200.5886
Daily SMA500.5916
Daily SMA1000.6002
Daily SMA2000.6101
 
Levels
Previous Daily High0.6055
Previous Daily Low0.5996
Previous Weekly High0.6002
Previous Weekly Low0.5877
Previous Monthly High0.6056
Previous Monthly Low0.5772
Daily Fibonacci 38.2%0.6033
Daily Fibonacci 61.8%0.6019
Daily Pivot Point S10.5994
Daily Pivot Point S20.5966
Daily Pivot Point S30.5935
Daily Pivot Point R10.6053
Daily Pivot Point R20.6083
Daily Pivot Point R30.6112

Author

Joshua Gibson

Joshua joins the FXStreet team as an Economics and Finance double major from Vancouver Island University with twelve years' experience as an independent trader focusing on technical analysis.

More from Joshua Gibson
Share:

Markets move fast. We move first.

Orange Juice Newsletter brings you expert driven insights - not headlines. Every day on your inbox.

By subscribing you agree to our Terms and conditions.

Editor's Picks

EUR/USD extends slide below 1.1700

The EUR/USD pair nears its weekly low at around 1.1660 in the American session on Tuesday, retreating from the 1.1750 price zone tested earlier in the day. Cautiously optimistic markets support the US Dollar in the near term.

GBP/USD consolidates around 1.3500; looks to US macro data for fresh impetus

The GBP/USD pair oscillates in a narrow range, around the 1.3500 psychological mark during the Asian session on Wednesday, and for now, seems to have stalled the previous day's retracement slide from its highest level since September 18. Moreover, the fundamental backdrop seems tilted in favor of bullish traders and suggests that the path of least resistance for spot prices is to the upside.

Gold extends upside to near $4,500 on Venezuela turmoil

Gold price climbs to near $4,500 during the early Asian trading hours on Wednesday. The precious metal rises by more than 1% in the day as geopolitical tensions and expectations of US rate cuts keep demand for gold high. The US ISM Services Purchasing Managers Index report will be published on Wednesday. 

Australia CPI likely to test RBA hawkishness

The Australian Bureau of Statistics will publish the Consumer Price Index data for November at 00:30 GMT on Wednesday. This is the second complete monthly CPI report, as the government continues to transition from the quarterly CPI to the monthly gauge as the primary measure of headline inflation.

Implications of US intervention in Venezuela

Events in Venezuela are top of mind for market participants, and while developments are associated with an elevated degree of uncertainty, we are not making any changes to our markets or economic forecasts as a result of the deposition of Nicolás Maduro. 

Cardano holds steady as bulls intensify push for breakout

Cardano rises above the 50-day EMA resistance amid a risk-on mood across the crypto market. The MACD upholds positive divergence, increasing the potential for a 20% breakout to $0.505.