NZD/USD Price Analysis: The Kiwi reaches a pivotal point
- NZD/USD has reached a key resistance level which it needs to break above to extend.
- Failure to break above the level would probably lead to continuation of the descending channel.
- The MACD has formed a bullish price pattern which adds weight to the upside view.

NZD/USD is trading in the 0.6020s after having risen for the fourth day in a row, on Monday. The pair is encountering significant resistance from the 50-day Simple Moving Average (SMA) and a major trendline. NZD/USD has reached a crossroads where it could either continue higher or revert to the bearish sentiment that has characterized the year so far.
To extend the bullish short-term gains NZD/USD has clocked up since the pivotal April 19 low, the pair will need to make a decisive break above the confluence of resistance it is bumping up against – if not, this could be an inflection point where the price turns and starts going lower again, in line with the medium-term bearish trend.
NZD/USD Daily Chart
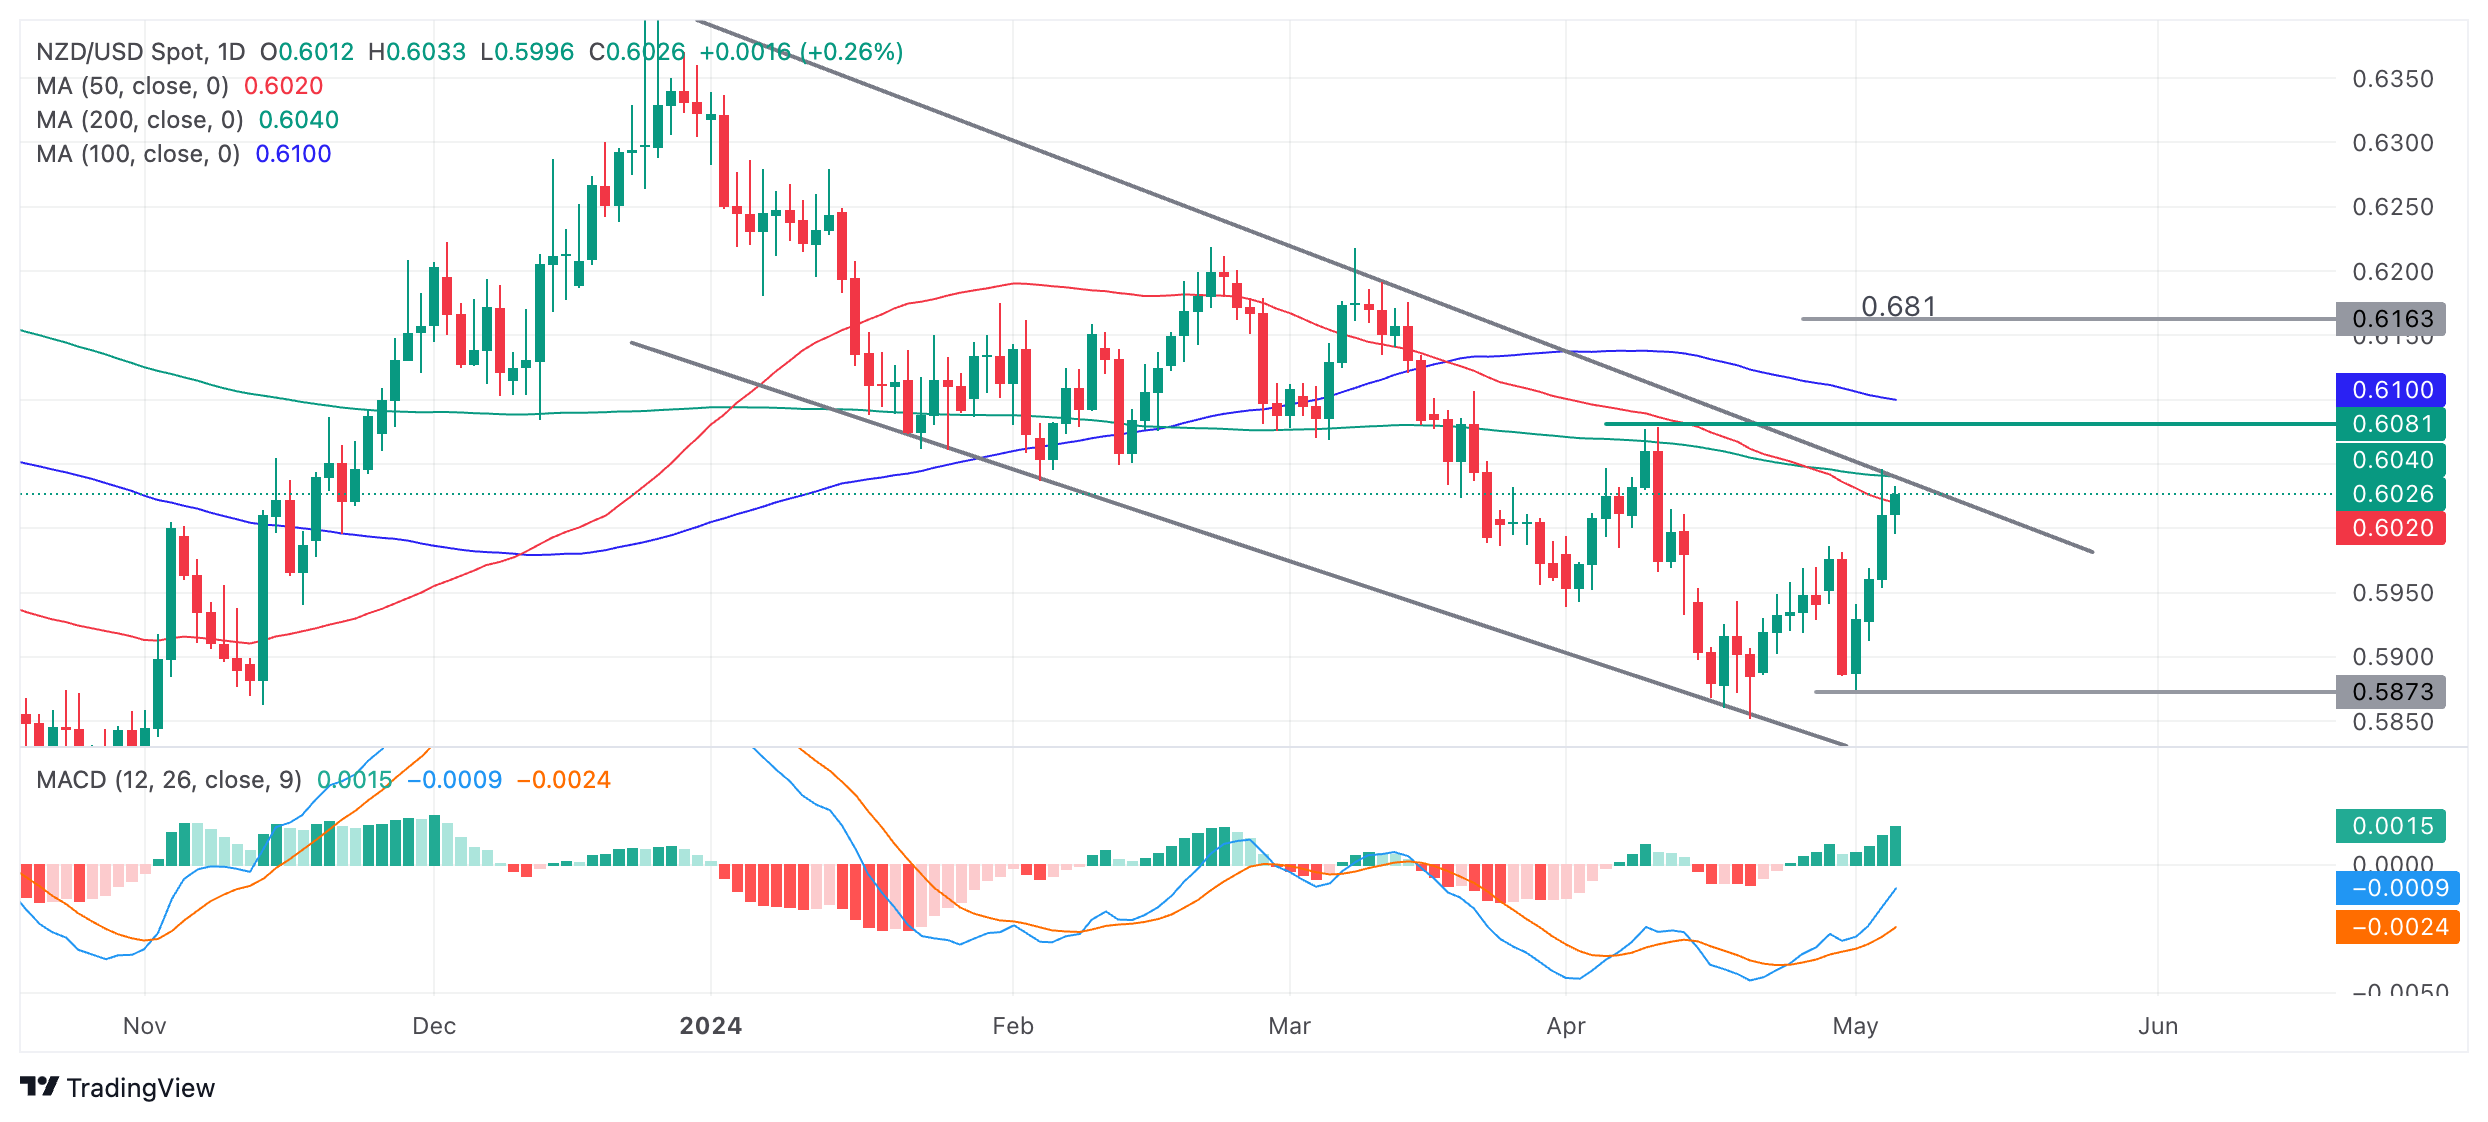
NZD/USD is testing resistance from the 50-day, 200-day SMA and the trendline for the down move since the start of 2024. Unless it breaks out it will probably continue back down to the 0.5870 lows, possibly even lower.
However, there are no signs yet on the chart that indicates the start of a new down-leg.
Given the strength of the move up since the April 19 lows and the strong accompanying bullish momentum reflected in the Moving Average Convergence Divergence (MACD) there is a chance a breakout from the channel could follow on. Further, the MACD has formed a bullish double bottom pattern during April which is a sign of a change in trend in the underlying price as well as the MACD.
A decisive break above the trendline would be required to indicate NZD/USD was going higher. Such a breakout would be signaled by a long bullish green daily candle breaking clearly above the trendline and closing near the high of the day. Alternatively three green candles in a row that broke clearly above could also indicate a decisive breakout. Price trading above the top of the last swing high at 0.6081 would also be a bullish sign.
Such a break, if it were to develop, would signal significant upside. The usual way to estimate how far a move will go following a trendline break is to take the move that directly preceded it and extrapolate that higher. For a conservative estimate the 0.681 Fibonacci ratio can be used. This gives a conservative target of 0.6163 and a full estimate of 0.6213.
Author

Joaquin Monfort
FXStreet
Joaquin Monfort is a financial writer and analyst with over 10 years experience writing about financial markets and alt data. He holds a degree in Anthropology from London University and a Diploma in Technical analysis.


