NZD/USD Price Analysis: Teasing ascending triangle breakdown on 4H chart
- NZD/USD heavily sold-off into risk-averse market conditions.
- Bears eyeing an ascending triangle breakdown on the 4H chart.
- RSI remains bearish, leaving floors open for further downside.

NZD/USD has reversed almost the entire gains recorded on Thursday, holding the lower ground below 0.7200 ass the haven demand for the US dollar continues to weigh on the higher-yielding kiwi.
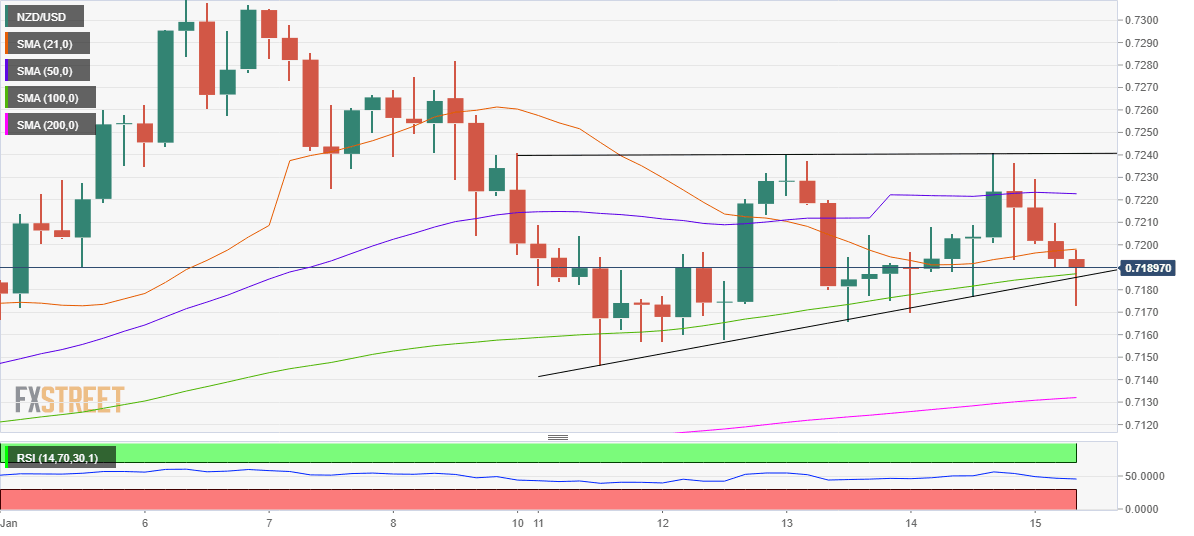
From a near-term technical perspective, the price is on the verge of confirming an ascending triangle breakdown on the four-chart.
The odds remain in favor of a downside break, given that the Relative Strength Index (RSI) points south below 50.00.
An hourly closing below the critical support at 0.7186, the confluence of the 100-simple moving average (SMA) and triangle support, will validate the bearish formation.
Subsequently, a drop towards the 200-SMA at 0.7132 cannot be ruled if the bears take over complete control.
On the flip side, the 21-SMA at 0.7200 needs to be recaptured to prompt a recovery towards the horizontal 50-SMA hurdle at 0.7222.
Further north, a sustained break above the pattern resistance at 0.7240 could invalidate the breakdown.
NZD/USD: Four-hour chart
NZD/USD: Additional levels
Author

Dhwani Mehta
FXStreet
Residing in Mumbai (India), Dhwani is a Senior Analyst and Manager of the Asian session at FXStreet. She has over 10 years of experience in analyzing and covering the global financial markets, with specialization in Forex and commodities markets.


