|

NZD/USD Price Analysis: Slides to over 1-week lows, below 0.6400 mark

  • NZD/USD extended the previous day’s rejection slide from 200-hour SMA.
  • The ongoing corrective slide could get extended towards the 0.6320 area.
  • The bullish flag supports prospects for the emergence of some dip-buying.

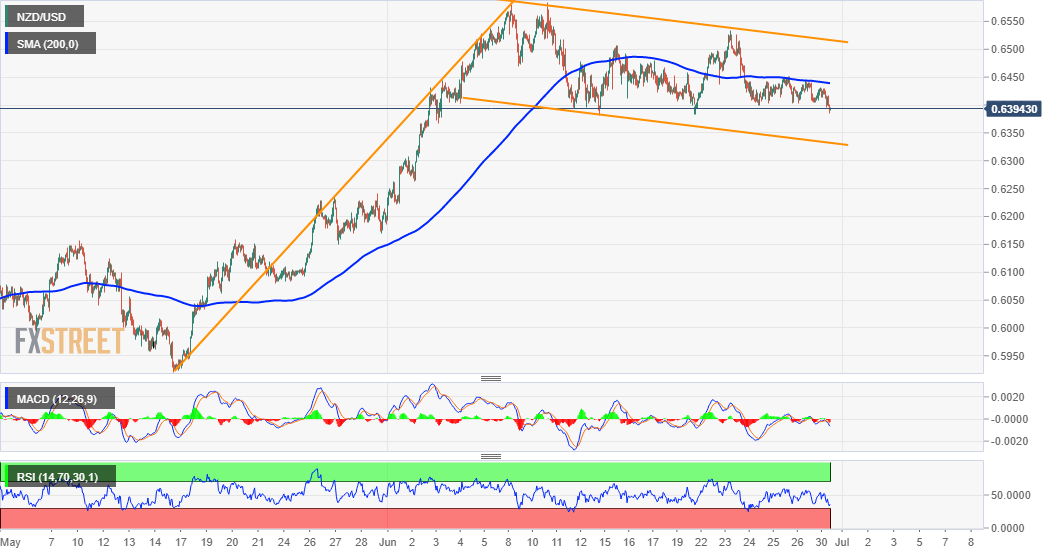
The NZD/USD pair extended its steady intraday fall and weakened further below the 0.6400 mark, hitting over one-week lows during the early European session.

The pair has now retreated back closer to last week's swing lows support, around the 0.6380 region. This comes on the back of the previous day's rejection near 200-hour SMA and support prospects for further weakness.

Meanwhile, oscillators on hourly charts have been drifting lower in the bearish territory and losing positive traction on the daily chart. This, in turn, reinforce the negative outlook amid a modest pickup in the USD demand.

Hence, some follow-through weakness back towards testing the very important 200-day SMA, around the 0.6320 region, now looks a distinct possibility. The said support coincides with the lower end of a short-term descending channel.

Against the backdrop of the pair's recent strong positive move witnessed over the past three months or so, the mentioned channel constitutes towards the formation of a bullish continuation flag pattern on short-term charts.

Hence, the ongoing corrective slide – though could get extended further – might still be seen as a buying opportunity. This, in turn, should help limit deeper losses and thus, warrant some caution for aggressive bearish traders.

NZD/USD 1-hourly chart

fxsoriginal

Technical levels to watch

NZD/USD

Overview
Today last price0.6391
Today Daily Change-0.0030
Today Daily Change %-0.47
Today daily open0.6421
 
Trends
Daily SMA200.6456
Daily SMA500.6231
Daily SMA1000.6177
Daily SMA2000.6326
 
Levels
Previous Daily High0.6444
Previous Daily Low0.6403
Previous Weekly High0.6534
Previous Weekly Low0.6383
Previous Monthly High0.6241
Previous Monthly Low0.5921
Daily Fibonacci 38.2%0.6428
Daily Fibonacci 61.8%0.6418
Daily Pivot Point S10.6401
Daily Pivot Point S20.6381
Daily Pivot Point S30.636
Daily Pivot Point R10.6442
Daily Pivot Point R20.6464
Daily Pivot Point R30.6484

Author

Haresh Menghani

Haresh Menghani is a detail-oriented professional with 10+ years of extensive experience in analysing the global financial markets.

More from Haresh Menghani
Share:

Editor's Picks

EUR/USD looks apathetic around 1.1770

EUR/USD comes under renewed pressure on Tuesday, deflating below the 1.1800 support and reversing two consecutive days of gains. The pair’s decline follows the persistent move higher in the US Dollar, as trade uncertainty dominates the sentiment ahead of President Trump’s SOTU speech.

GBP/USD regains 1.3500 and above

GBP/USD extends its advance for the third day in a row on Tuesday, this time retesting the area beyond the 1.3500 hurdle. Cable’s uptick comes despite decent gains in the Greenback and the dovish message from the BoE’s Bailey at the UK Parliament.

Gold appears offered around $5,150

Gold is giving back a good portion of the recent multi-day rally, receding to the $5,150 zone per troy ounce amid the decent bounce in the US Dollar and mixed US Treasuty yields. In the meantime, markets’ attention remain on upcoming comments from Fed speakers.

Crypto Today: Bitcoin, Ethereum, XRP come under renewed pressure amid ETF outflows, tariff uncertainty

Bitcoin, Ethereum and Ripple are trading under increasing selling pressure at the time of writing on Tuesday, as market participants navigate renewed tariff uncertainty. The Crypto King holds above $63,000, down 2% intraday from its $64,656 open.

The Citrini report: How a debatable AI narrative can shake Wall Street

That AI-related headline alone was enough to rattle investors.US stocks slid sharply on Monday after a widely circulated Citrini Research memo outlined a hypothetical “2028 Global Intelligence Crisis”, warning that rapid AI adoption could push US unemployment into double digits as early as by mid-2028.

XRP pressured by weak ETF flows and declining retail interest

Ripple (XRP) is edging lower, trading above its intraday low of $1.32 at the time of writing on Tuesday. The decline from its weekly opening of $1.39 reflects heightened volatility in the broader cryptocurrency market, accentuated by tariff-triggered uncertainty.