|

NZD/USD Price Analysis: Sellers pause at 0.6000 after over 1.0% fall on RBNZ day

  • NZD/USD remains on the back foot after RBNZ.
  • The RBNZ held OCR steady at 0.25% but expanded QE, policymakers spoke dovish.
  • A five-week-old support line on the bears’ radar below 0.6000.
  • 61.8% Fibonacci retracement, April high can lure buyers on the upside.

Having dropped over 1.0% following the RBNZ’s dovish appearance, NZD/USD bears catch a breath around 0.6000, down 1.15% on a day, ahead of the European open on Wednesday.

Also Read: RBNZ Minutes: A negative OCR will become an option in future

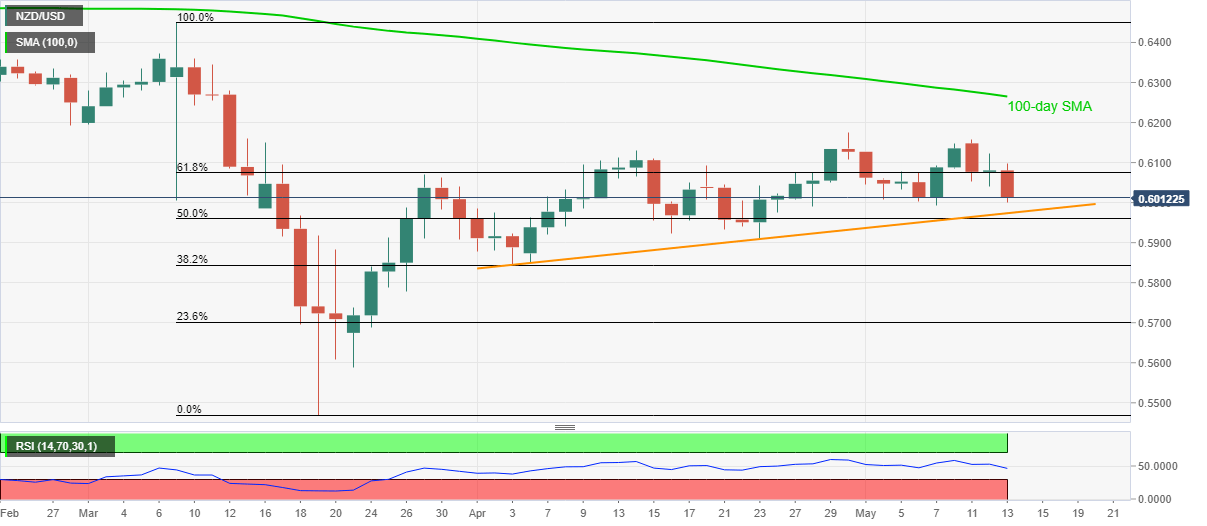
While the expansion of Quantitative Easing (QE) and fears of negative rates offer fundamental weakness to the pair, it’s a break below 61.8% Fibonacci retracement of March month fall keeps technical analysis in favor of the sellers.

Read: RBNZ’s Orr: Monetary Policy Committee is prepared to do whatever it takes

Even so, a sustained break below 0.6000 will be needed for the further downside towards a multi-day-old support line, near 0.5970.

Though, pair’s weakness past-0.5970 might not hesitate to challenge 50% Fibonacci retracement and April low, respectively around 0.5960 and 0.5910.

On the contrary, a daily closing beyond 61.8% Fibonacci retracement level of 0.6075 can renew buying pressure towards April month high surrounding 0.6175. Additionally, 100-day SMA near 0.6265 can please the bulls afterward.

NZD/USD daily chart

Trend: Pullback expected

Additional important levels

Overview
Today last price0.6012
Today Daily Change-68 pips
Today Daily Change %-1.12%
Today daily open0.608
 
Trends
Daily SMA200.6044
Daily SMA500.6027
Daily SMA1000.6271
Daily SMA2000.6337
 
Levels
Previous Daily High0.6124
Previous Daily Low0.6041
Previous Weekly High0.6148
Previous Weekly Low0.5994
Previous Monthly High0.6176
Previous Monthly Low0.5843
Daily Fibonacci 38.2%0.6092
Daily Fibonacci 61.8%0.6073
Daily Pivot Point S10.604
Daily Pivot Point S20.5999
Daily Pivot Point S30.5957
Daily Pivot Point R10.6122
Daily Pivot Point R20.6164
Daily Pivot Point R30.6205

Author

Anil Panchal

Anil Panchal

FXStreet

Anil Panchal has nearly 15 years of experience in tracking financial markets. With a keen interest in macroeconomics, Anil aptly tracks global news/updates and stays well-informed about the global financial moves and their implications.

More from Anil Panchal
Share:

Editor's Picks

EUR/USD seems fragile below 1.1700 as Middle East war boosts energy prices

The EUR/USD pair trades flat at around 1.1680 during the Asian trading session on Tuesday, but broadly seems vulnerable, being close to its five-week low. The major currency pair is under pressure as surging oil prices due to the United States-Israel war with Iran have increased the risks of higher inflation for the Old Continent.

GBP/USD hovers around 1.3400 with bearish pressure intact

GBP/USD edges higher after three days of losses, trading around 1.3400 during the Asian hours on Tuesday. The technical analysis of the daily chart indicates an ongoing bearish bias, as the pair trades within a descending channel pattern.

Gold sticks to gains above $5,350 amid sustained safe-haven demand; firmer USD caps gains

Gold sticks to its positive bias for the third straight day and trades above the $5,350 level heading into the European session on Tuesday. Concerns about a broader regional conflict in the Middle East continue to weigh on investors' sentiment and underpin demand for the traditional safe-haven bullion.

Stellar risks deeper losses as derivatives metrics turn negative

Stellar is trading red below $0.16 at the time of writing on Tuesday, after a slight recovery the previous day. Weakening derivatives data caps the recovery, while an unfavorable technical outlook projects a deeper correction for the XLM token in the upcoming days.

The market is not panicking it is repricing the probability distribution of Oil and time

At the end of the day, markets do not trade morality or geopolitics. They trade transmission channels. And the only channel that truly matters in this maelstrom runs through the price of energy and the time value of money.

Hyperliquid Price Forecast: HYPE rises on commodities demand amid US-Iran war

Hyperliquid (HYPE) steadies above $33 at press time on Tuesday, marking its fourth consecutive day of recovery in a broadly volatile market due to the ongoing US-Israel strikes on Iran.