NZD/USD Price Analysis: Pulls back from 100-SMA on an eventful day


  • NZD/USD remains pressured around intraday low following multiple catalyst from Australia, China and New Zealand.
  • Firmer Aussie jobs report, PBOC rate cut couldn’t withstand NZ PM Ardern’s warning.
  • RSI retreat, sluggish MACD direct sellers towards the monthly support.
  • Two-month-old horizontal area acts as an additional upside filter.

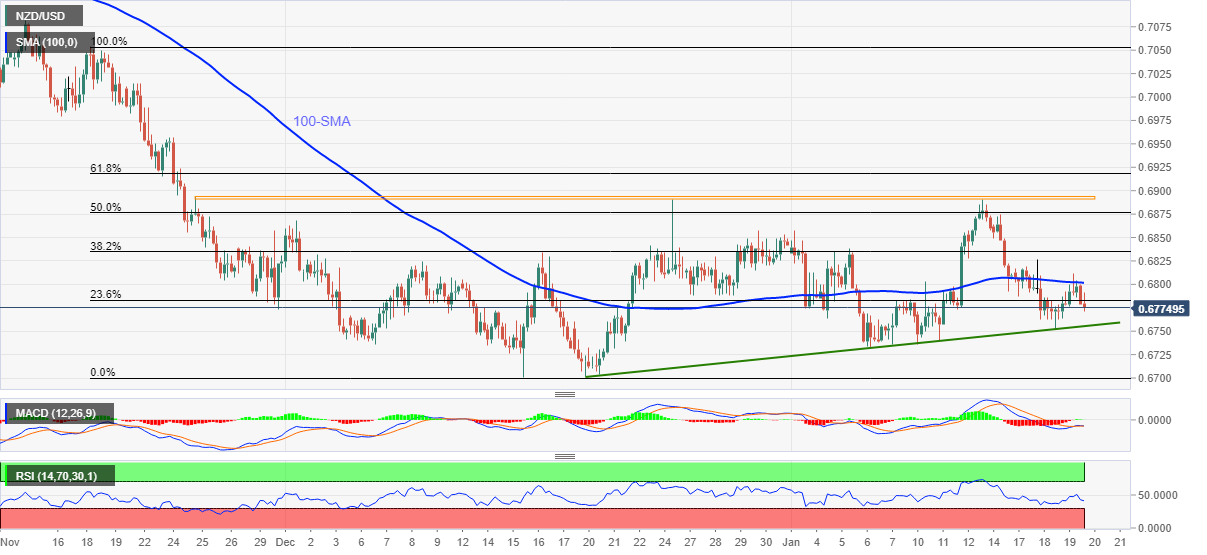
NZD/USD remains on the back foot around 0.6775, extending early Asian losses during Thursday.

In doing so, the Kiwi pair reverses from 100-SMA while justifying New Zealand Prime Minister Jacinda Ardern’s warning to tighten the activity measures if the Omicron spreads faster.

Read: NZ PM Ardern: Won’t resort to lockdowns when omicron arrives

With this, the quote rejects the previous bullish bias due to the upbeat Aussie jobs report for December and the People’s Bank of China’s (PBOC) first 5-year Loan Prime Rate (LPR) cut in 21 months.

That said, the downward sloping RSI line, not oversold, joins sluggish MACD and failures to cross the 100-SMA to direct NZD/USD prices towards a one-month-old rising support line, around 0.6755 by the press time.

In a case where the pair sellers dominate past 0.6755, the year 2021 trough surrounding 0.6700 will regain the market’s attention.

Alternatively, recovery moves beyond 100-SMA level of 0.6800 may aim for 0.6860 but a horizontal area comprising multiple levels marked since late November, close to 0.6890-95, will be a tough nut to crack for the NZD/USD bulls.

Should NZD/USD prices rally past 0.6895, the 0.6900 will act as a validation point for the rally towards the 0.7000 psychological magnet.

NZD/USD: Four-hour chart

Trend: Further weakness expected

Additional important levels

Overview
Today last price 0.6777
Today Daily Change -0.0012
Today Daily Change % -0.18%
Today daily open 0.6789
 
Trends
Daily SMA20 0.6805
Daily SMA50 0.6835
Daily SMA100 0.6951
Daily SMA200 0.7018
 
Levels
Previous Daily High 0.6812
Previous Daily Low 0.6763
Previous Weekly High 0.6891
Previous Weekly Low 0.6736
Previous Monthly High 0.6891
Previous Monthly Low 0.6701
Daily Fibonacci 38.2% 0.6793
Daily Fibonacci 61.8% 0.6782
Daily Pivot Point S1 0.6764
Daily Pivot Point S2 0.6739
Daily Pivot Point S3 0.6715
Daily Pivot Point R1 0.6813
Daily Pivot Point R2 0.6837
Daily Pivot Point R3 0.6862


Share: Feed news

Information on these pages contains forward-looking statements that involve risks and uncertainties. Markets and instruments profiled on this page are for informational purposes only and should not in any way come across as a recommendation to buy or sell in these assets. You should do your own thorough research before making any investment decisions. FXStreet does not in any way guarantee that this information is free from mistakes, errors, or material misstatements. It also does not guarantee that this information is of a timely nature. Investing in Open Markets involves a great deal of risk, including the loss of all or a portion of your investment, as well as emotional distress. All risks, losses and costs associated with investing, including total loss of principal, are your responsibility. The views and opinions expressed in this article are those of the authors and do not necessarily reflect the official policy or position of FXStreet nor its advertisers. The author will not be held responsible for information that is found at the end of links posted on this page.

If not otherwise explicitly mentioned in the body of the article, at the time of writing, the author has no position in any stock mentioned in this article and no business relationship with any company mentioned. The author has not received compensation for writing this article, other than from FXStreet.

FXStreet and the author do not provide personalized recommendations. The author makes no representations as to the accuracy, completeness, or suitability of this information. FXStreet and the author will not be liable for any errors, omissions or any losses, injuries or damages arising from this information and its display or use. Errors and omissions excepted.

The author and FXStreet are not registered investment advisors and nothing in this article is intended to be investment advice.

Recommended content


Recommended content

Editors’ Picks

EUR/USD clings to daily gains above 1.0650

EUR/USD clings to daily gains above 1.0650

EUR/USD gained traction and turned positive on the day above 1.0650. The improvement seen in risk mood following the earlier flight to safety weighs on the US Dollar ahead of the weekend and helps the pair push higher.

EUR/USD News

GBP/USD recovers toward 1.2450 after UK Retail Sales data

GBP/USD recovers toward 1.2450 after UK Retail Sales data

GBP/USD reversed its direction and advanced to the 1.2450 area after touching a fresh multi-month low below 1.2400 in the Asian session. The positive shift seen in risk mood on easing fears over a deepening Iran-Israel conflict supports the pair.

GBP/USD News

Gold holds steady at around $2,380 following earlier spike

Gold holds steady at around $2,380 following earlier spike

Gold stabilized near $2,380 after spiking above $2,400 with the immediate reaction to reports of Israel striking Iran. Meanwhile, the pullback seen in the US Treasury bond yields helps XAU/USD hold its ground.

Gold News

Bitcoin Weekly Forecast: BTC post-halving rally could be partially priced in Premium

Bitcoin Weekly Forecast: BTC post-halving rally could be partially priced in

Bitcoin price shows no signs of directional bias while it holds above  $60,000. The fourth BTC halving is partially priced in, according to Deutsche Bank’s research. 

Read more

Week ahead – US GDP and BoJ decision on top of next week’s agenda

Week ahead – US GDP and BoJ decision on top of next week’s agenda

US GDP, core PCE and PMIs the next tests for the Dollar. Investors await BoJ for guidance about next rate hike. EU and UK PMIs, as well as Australian CPIs also on tap.

Read more

Forex MAJORS

Cryptocurrencies

Signatures