NZD/USD Price Analysis: Gathers strength for a breakout amid improved risk sentiment
- NZD/USD is expected to continue its upside momentum amid a cheerful market mood.
- The hawkish commentary from Fed Barkin failed to provide support to the USD Index.
- NZD/USD is at a make or a break near the edge of the Symmetrical Triangle pattern.

The NZD/USD pair is making efforts in keeping its auction above 0.6260 in the early Tokyo session. The Kiwi asset is expected to multiply its upside momentum as the US Dollar Index (DXY) seems vulnerable above 102.00 amid positive market sentiment. The hawkish commentary from Richmond Federal Reserve (Fed) President Thomas Barkin failed to provide support to the USD Index. According to Fed Barkin, there is a lot of money available for spending among households.
S&P500 continued to remain in a positive trajectory as United States authorities have infused confidence among the market participants that the US banking system is ‘sound and resilient’ and a collapse of three mid-size banks cannot shake the overall banking system.
The New Zealand Dollar will remain in action ahead of China’s Caixin Manufacturing PMI data, which will release on Monday. But before that, official PMI data by the National Bureau of Statistics (NBS) will be keenly watched.
It is worth noting that New Zealand is one of the leading trading partners of China and higher PMI figures would also strengthen the New Zealand Dollar.
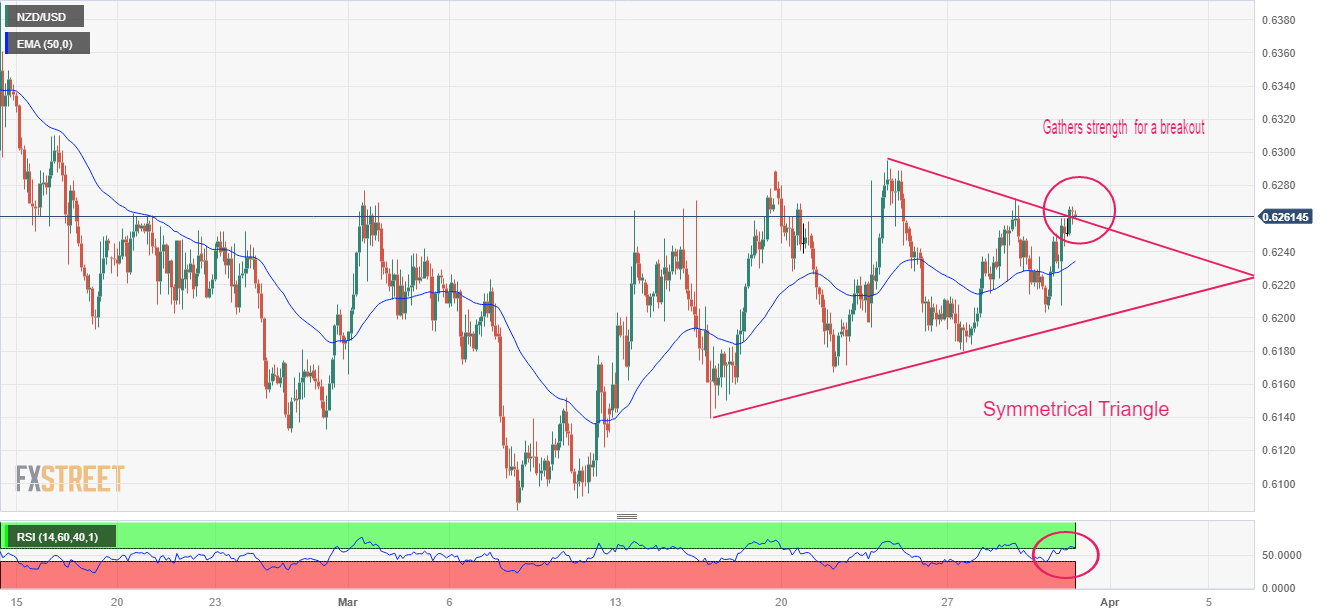
On a two-hour scale, NZD/USD is at a make or a break near the downward-sloping trendline of the Symmetrical Triangle chart pattern. The downward-sloping trendline of the aforementioned pattern is plotted from March 23 high at 0.6295 while the upward-sloping trendline is placed from Marc 16 low at 0.6161.
The Kiwi asset is auctioning above the 50-period Exponential Moving Average (EMA), which indicates the short-term trend is bullish.
Meanwhile, the Relative Strength Index (RSI) (14) is looking to climb above 60.00, which will result in the activation of bullish momentum.
A decisive break above March 29 high at 0.6272 will drive the asset towards March 23 high at 0.6295 followed by February 07 high at 0.6363.
On the flip side, a breakdown of March 21 low at 0.6167 will drag the asset toward March 15 low at 0.6139. A slippage below the latter will expose the asset for more downside toward the round-level support at 0.6100.
NZD/USD two-hour chart
Author

Sagar Dua
FXStreet
Sagar Dua is associated with the financial markets from his college days. Along with pursuing post-graduation in Commerce in 2014, he started his markets training with chart analysis.


