- NZD/USD stays offered around intraday low, extends previous day’s pullback.
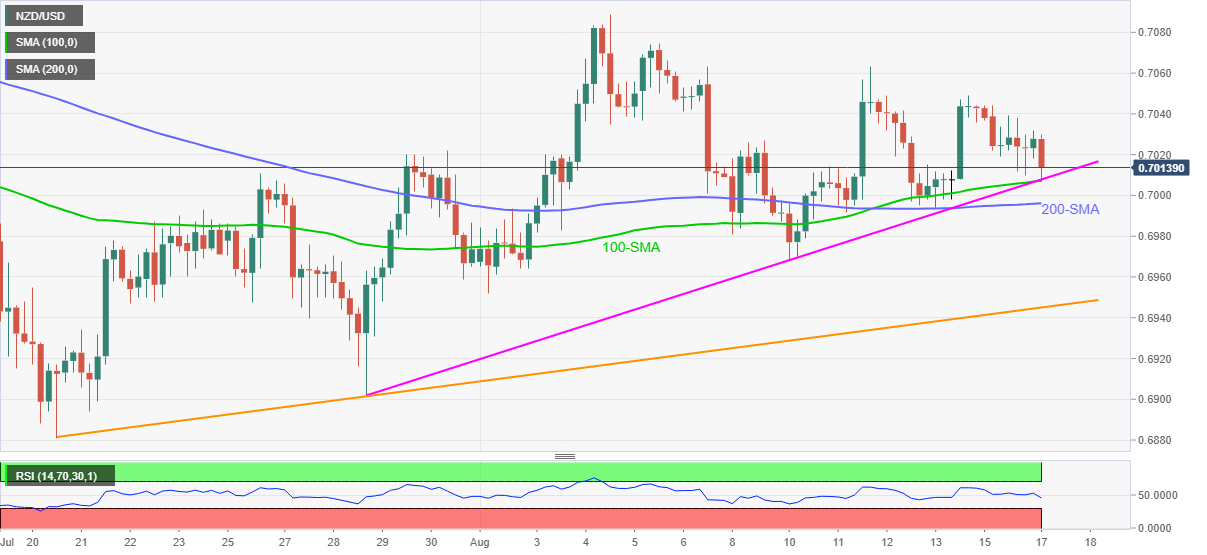
- Three-week-old rising trend line, key SMAs challenge the pair’s further downside.
- Last week’s top can entertain short-term buyers during corrective pullback.
Despite recently bouncing off an intraday low of 0.7007, NZD/USD remains pressured during early Tuesday.
The kiwi pair’s latest bounce could be linked to the failures to conquer a confluence of 100-SMA and an ascending trend line from July 28, near 0.7005.
Even if the pair manages to break the 0.7005 support, the 0.7000 round figure and 200-SMA near 0.6995 challenge the NZD/USD sellers before directing them to the monthly low near 0.6950.
On the contrary, the quote’s rebound needs to cross the previous week’s top surrounding 0.7065 to aim for the 0.7100 threshold.
During the rise, the early August tops surrounding 0.7075 and 0.7090 may offer intermediate halts whereas July’s peak of 0.7106 can act as an extra filter to the north.
Overall, NZD/USD grinds lower but is near to the key support and hence needs a strong catalyst to conquer the same.
NZD/USD: Four-hour chart
Trend: Further weakness expected
Information on these pages contains forward-looking statements that involve risks and uncertainties. Markets and instruments profiled on this page are for informational purposes only and should not in any way come across as a recommendation to buy or sell in these assets. You should do your own thorough research before making any investment decisions. FXStreet does not in any way guarantee that this information is free from mistakes, errors, or material misstatements. It also does not guarantee that this information is of a timely nature. Investing in Open Markets involves a great deal of risk, including the loss of all or a portion of your investment, as well as emotional distress. All risks, losses and costs associated with investing, including total loss of principal, are your responsibility. The views and opinions expressed in this article are those of the authors and do not necessarily reflect the official policy or position of FXStreet nor its advertisers. The author will not be held responsible for information that is found at the end of links posted on this page.
If not otherwise explicitly mentioned in the body of the article, at the time of writing, the author has no position in any stock mentioned in this article and no business relationship with any company mentioned. The author has not received compensation for writing this article, other than from FXStreet.
FXStreet and the author do not provide personalized recommendations. The author makes no representations as to the accuracy, completeness, or suitability of this information. FXStreet and the author will not be liable for any errors, omissions or any losses, injuries or damages arising from this information and its display or use. Errors and omissions excepted.
The author and FXStreet are not registered investment advisors and nothing in this article is intended to be investment advice.
Recommended content
Editors’ Picks
AUD/USD retargets the 0.6600 barrier and above
AUD/USD extended its positive streak for the sixth session in a row at the beginning of the week, managing to retest the transitory 100-day SMA near 0.6580 on the back of the solid performance of the commodity complex.
EUR/USD keeps the bullish bias above 1.0700
EUR/USD rapidly set aside Friday’s decline and regained strong upside traction in response to the marked retracement in the Greenback following the still-unconfirmed FX intervention by the Japanese MoF.
Gold advances for a third consecutive day
Gold fluctuates in a relatively tight channel above $2,330 on Monday. The benchmark 10-year US Treasury bond yield corrects lower and helps XAU/USD limit its losses ahead of this week's key Fed policy meeting.
Bitcoin price dips to $62K range despite growing international BTC validation via spot ETFs
Bitcoin (BTC) price closed down for four weeks in a row, based on the weekly chart, and could be on track for another red candle this week. The last time it did this was in the middle of the bear market when it fell by 42% within a span of nine weeks.
Japan intervention: Will it work?
Dear Japan Intervenes in the Yen for the first time since November 2022 Will it work? Have we seen a top in USDJPY? Let's go through the charts.