NZD/USD Price Analysis: Bears attempt to take control at a key support structure at 0.6340
- NZD/USD is under pressure and bears expect a downside continuation from key resistance structure.
- A 15-minute price imbalance has shown up between 0.6365 and 0.6373 which could be mitigated and serve as resistance thereafter.
- Bears are not in the clear until a change of structure in the 4-hour time frame. This will require a break of 0.6340.

As per the prior analysis, NZD/USD Price Analysis: Bulls move in from critical support, bears eye an opportunity, and NZD/USD bulls move in at the start of the week but bears are lurking, where it was stated that the bulls have moved in and this was giving the bears an opportunity for a discount, the bears have indeed capitalized on the sweep of liquidity to 0.6400.
NZD/USD prior analysis
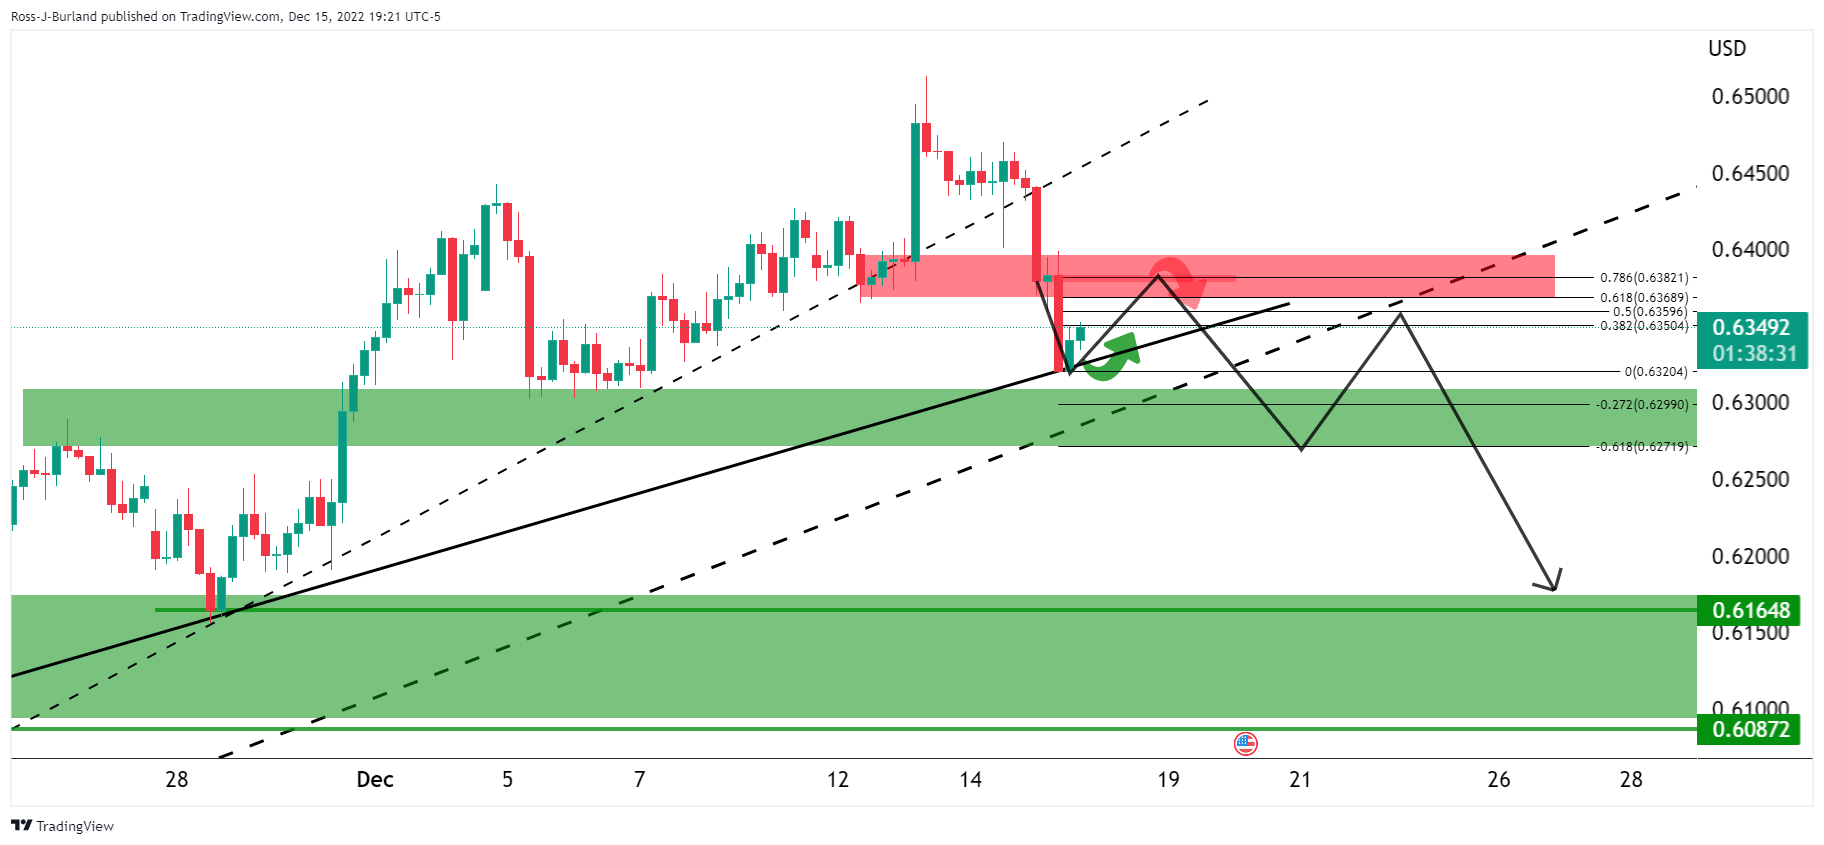
The 4-hour time frame showed the price correcting towards the upside, in accordance with the daily chart analysis.

We saw the correction into resistance and bears were expected to be in anticipation of a bearish structure forming which could be leant against in the prospects of a downside continuation.
NZD/USD update
Zoomed in...
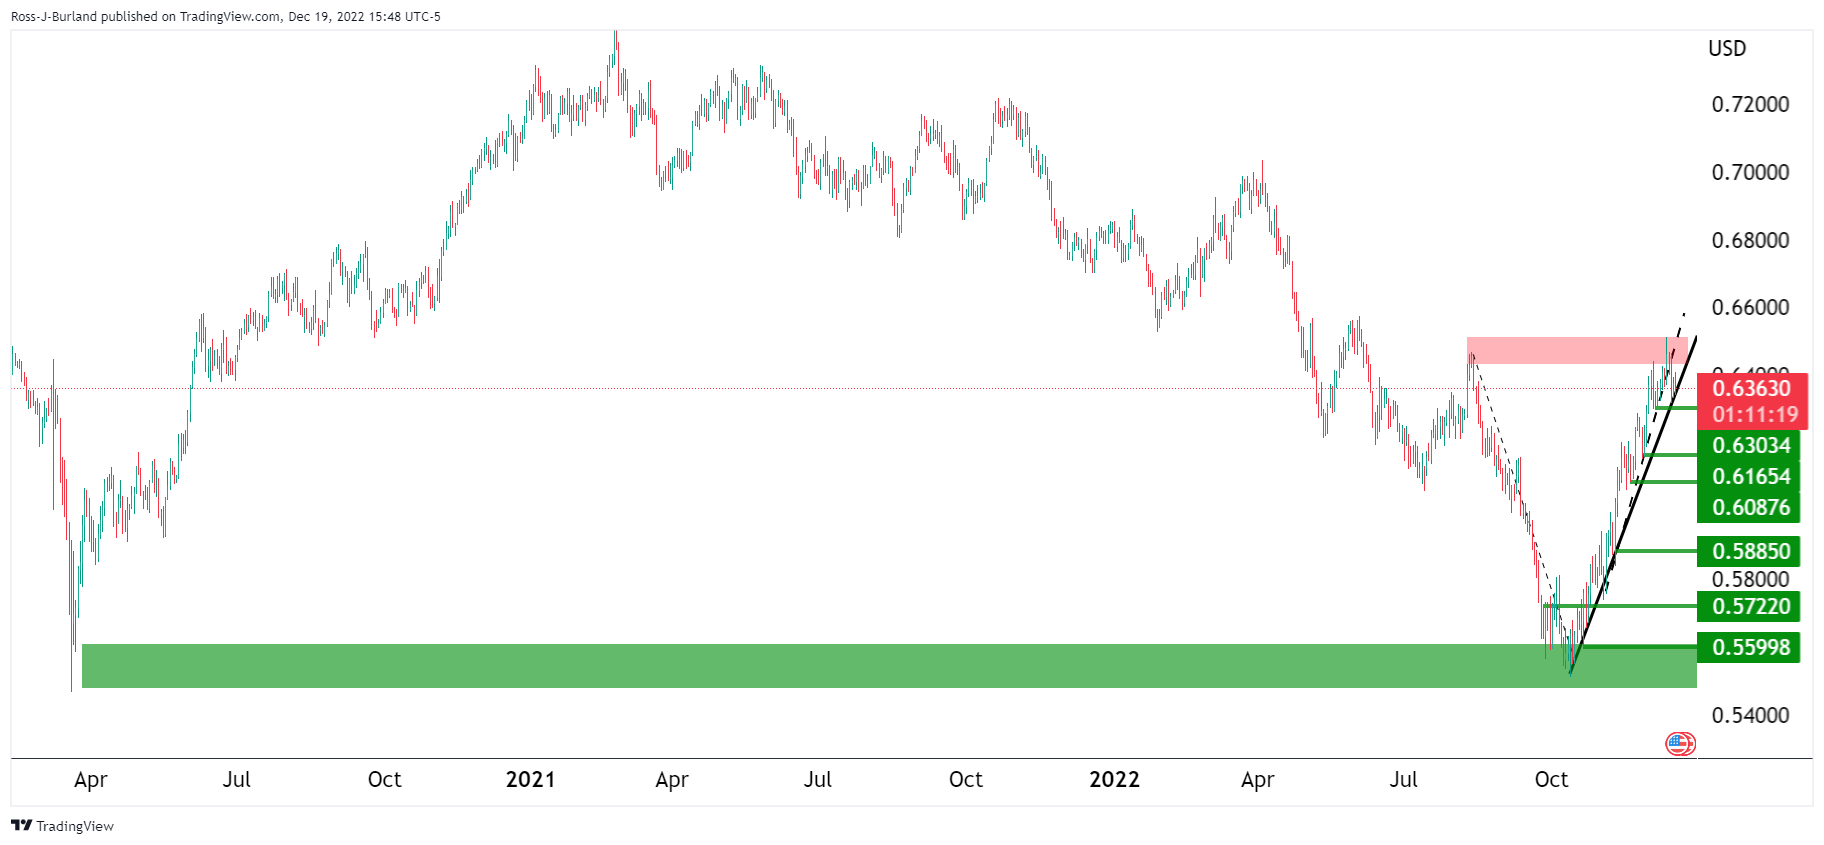
The above daily charts show that the price is decelerating on the bid and this has resulted in a topping formation in the form of an M-pattern. The bulls are testing the neckline resistance near a 50% mean reversion of the prior bearish impulse that is so far capping the correction.
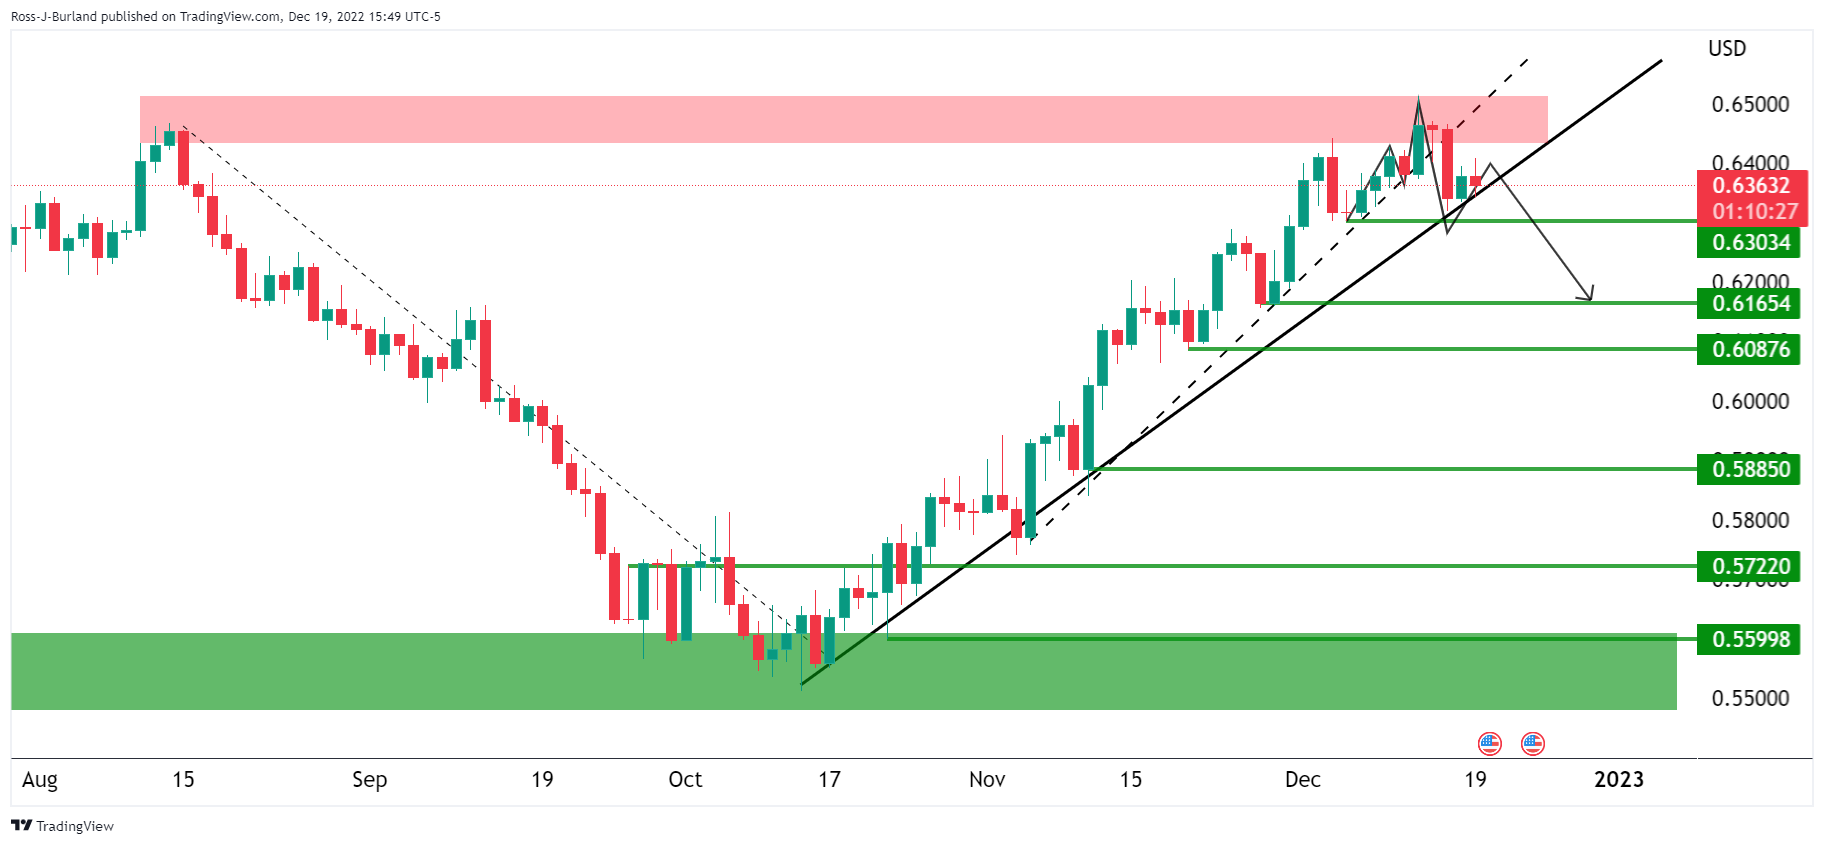
NZD/USD H4 chart
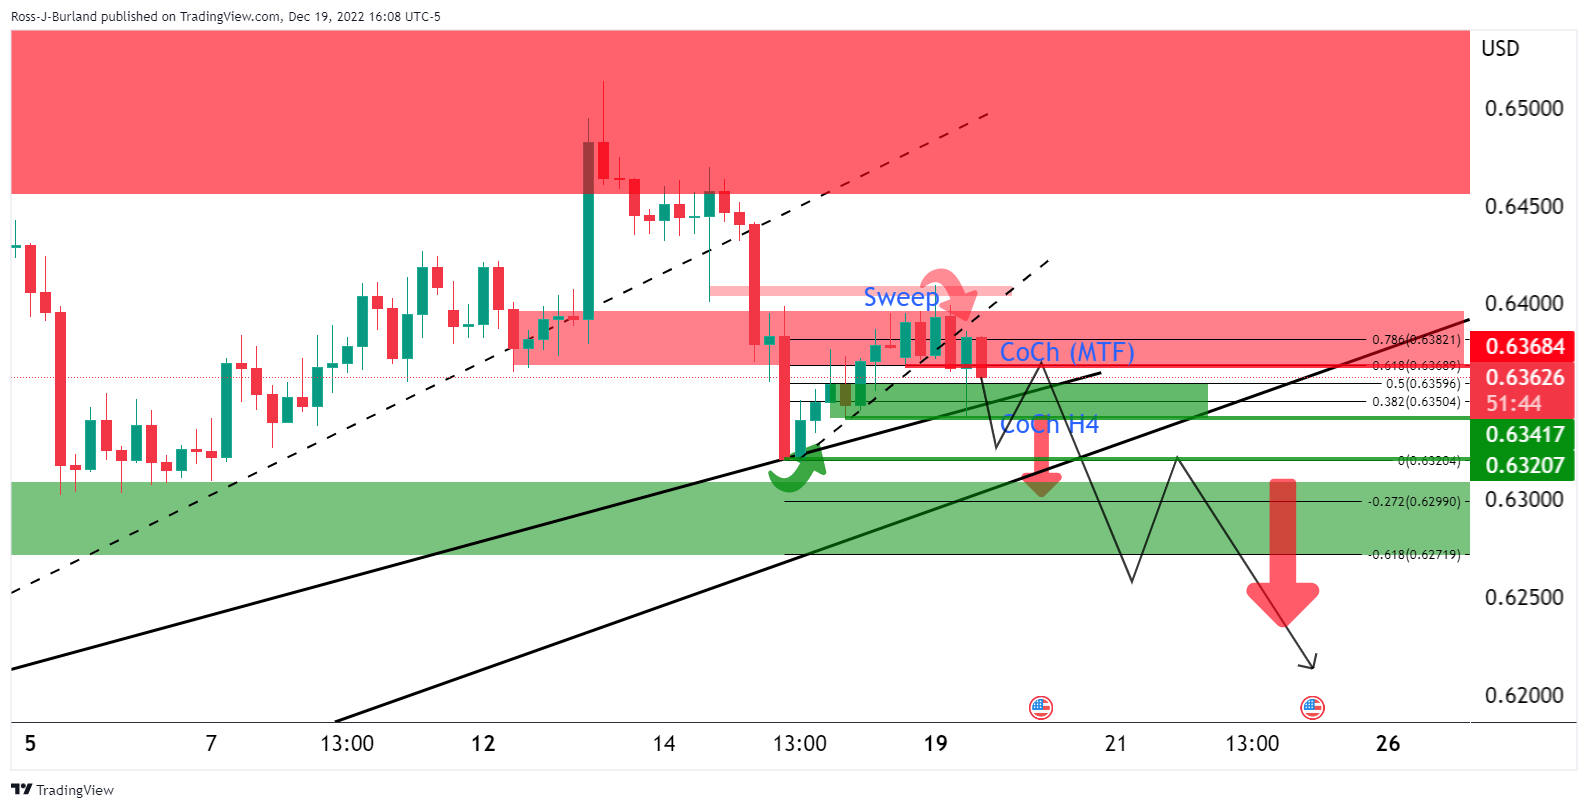
The price has swept the liquidity near 0.64 in the form of stops and this has resulted in a move lower and a change of charter (CoCh MTF (multi time frame)) in structure, from bullish to bearish, on the lower time frames around 0.6370.
However, the bears are not in the clear until a change of structure in the 4-hour time frame. This will require a break of 0.6340.
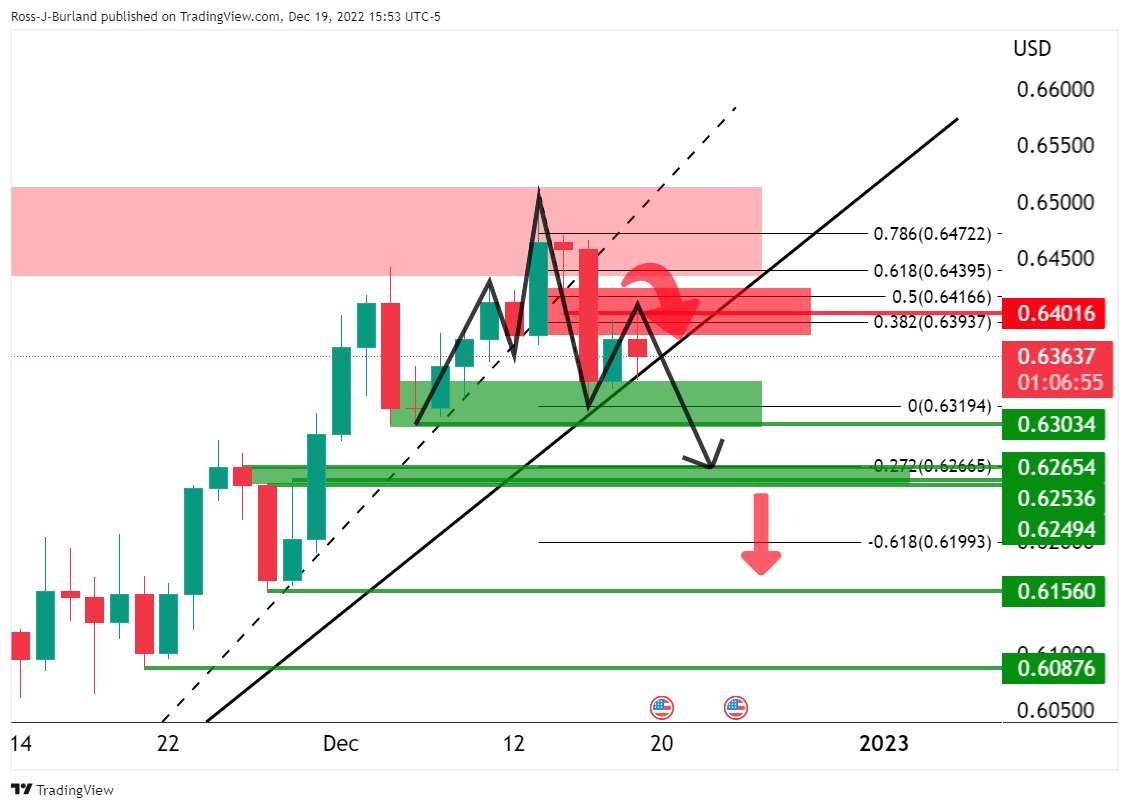
NZD/USD M15 chart
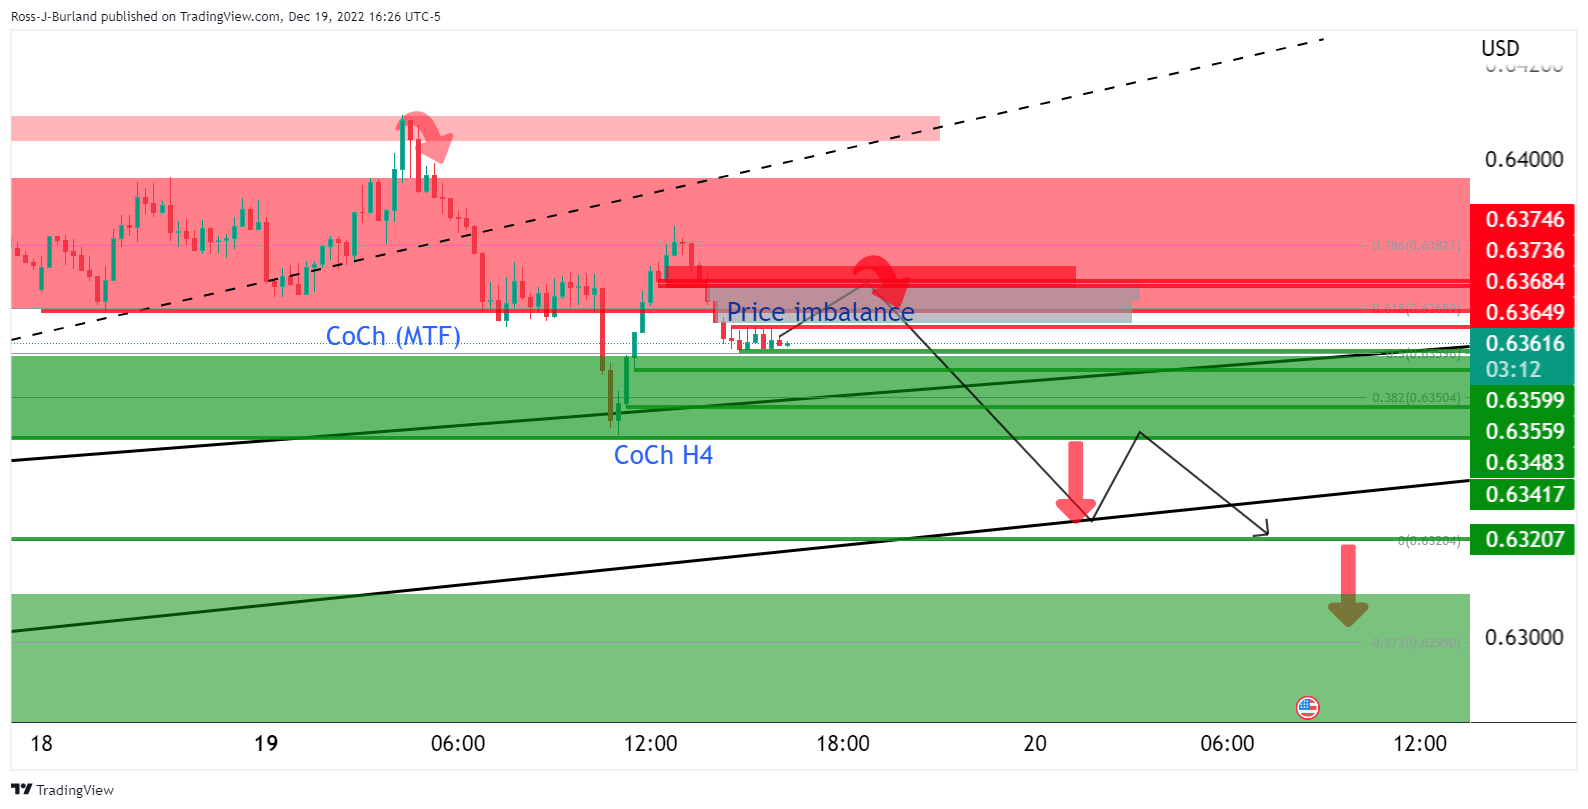
If there are still bears on the sidelines, then they might be lured in at a discount should the price correct back into the resistance area and a price imbalance that has shown up on the 15-min chart between 0.6365 and 0.6373.
Author

Ross J Burland
FXStreet
Ross J Burland, born in England, UK, is a sportsman at heart. He played Rugby and Judo for his county, Kent and the South East of England Rugby team.


