|

NZD/USD drops to the 0.6310s as China’s manufacturing activity slows

  • NZD/USD retraces after hitting 0.6370, as investors’ sentiment remains upbeat.
  • Weaker than expected, China’s PMIs would likely hurt the NZD/USD climbing prospects to the 0.6400 area.
  • IMF’s Georgieva:” Global economy faces a tougher year than 2022.”

The New Zealand Dollar (NZD) retraces from two-week highs around 0.6370s vs. the USD Dollar (USD) and stumbles to 0.6310s amidst a dull North American session, with US financial markets closed on the observance of new year’s eve. Hence, the NZD/USD drops 0.42% after hitting a daily high of 0.6345, trading at 0.6318.

European equities finished with gains, courtesy of an improvement in market mood. An absent New Zealand and United States (US) economic docket keep most G8 currency pairs within familiar ranges ahead of a pack worldwide economic calendar. Nevertheless, worst than expected, China’s PMIs revealed by the National Bureau of Statistics (NBS) show a gloomy outlook for the second-largest economy in the world. Figures came at 47.0 from 48.0 in November, its most significant drop since the early days of the pandemic.

That said, the NZD/USD pair edged lower, while the US Dollar Index, a gauge of the greenback’s performance against six currencies, advanced 0.14% to 103.63, rebounding at around six-month lows hit during the last week at 103.38.

Aside from this, the International Monetary Fund (IMF) director Kristalina Georgieva said the global economy faces “a tougher year than the year we leave behind.” Georgieva added that 1/3 of the global economy would hit a recession, impacted mainly by the three largest economies, the US, EU, and China, which “are all slowing down simultaneously.”

NZD/USD Price Analysis: Technical outlook

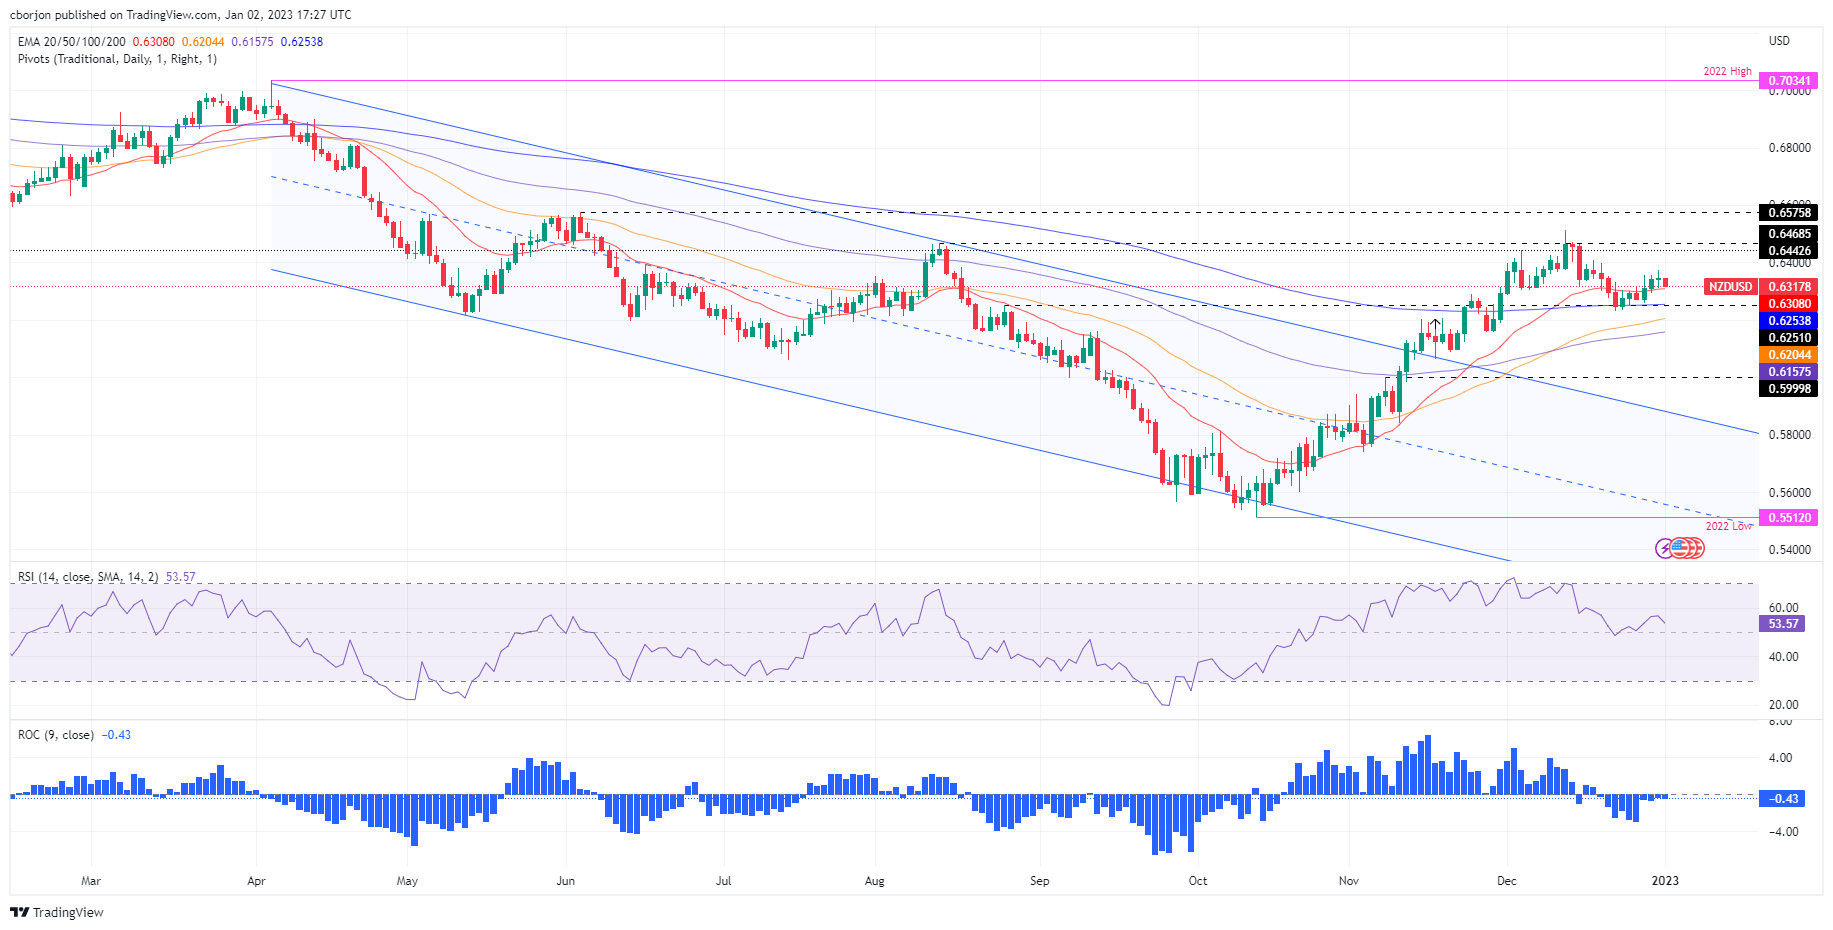
From a daily chart perspective, the NZD/USD pair remains upward biased, though headed for consolidation, as the 20-day Exponential Moving Average (EMA) at 0.6308 acts like a magnet, dragging the exchange rate toward its price level. Oscillators like the Relative Strength Index (RSI) and the Rate of Change (RoC), aim towards their mid-line, suggesting that buying pressure is easing. But if the NZD/USD pair remains above 0.6300, that could pave the way toward higher prices.

Therefore, the NZD/USD first resistance would be 0.6400. Break above would expose the August 12 daily high of 0.64668, followed by 0.6500.

NZD/USD

Overview
Today last price0.6316
Today Daily Change-0.0032
Today Daily Change %-0.50
Today daily open0.6348
 
Trends
Daily SMA200.6346
Daily SMA500.616
Daily SMA1000.604
Daily SMA2000.6241
 
Levels
Previous Daily High0.6373
Previous Daily Low0.631
Previous Weekly High0.6373
Previous Weekly Low0.6253
Previous Monthly High0.6514
Previous Monthly Low0.623
Daily Fibonacci 38.2%0.6334
Daily Fibonacci 61.8%0.6349
Daily Pivot Point S10.6315
Daily Pivot Point S20.6281
Daily Pivot Point S30.6252
Daily Pivot Point R10.6377
Daily Pivot Point R20.6406
Daily Pivot Point R30.644

Author

Christian Borjon Valencia

Markets analyst, news editor, and trading instructor with over 14 years of experience across FX, commodities, US equity indices, and global macro markets.

More from Christian Borjon Valencia
Share:

Editor's Picks

EUR/USD stays bid near 1.1560, focus shifts to the ECB

EUR/USD extends its weekly recovery for the third day in a row on Wednesday, navigating in a sidelined fashion around 1.1560 on the back of decent losses in the US Dollar. In the meantime, market participants continue to assess the latest US inflation data while hifting its attention to the ECB event on Thursday.

GBP/USD recedes from tops, hovers around 1.3400

GBP/USD could not sustain the initial bull run and is now slipping back toward the 1.3400 neighbourhood on Wednesday. Cable’s continuation of the ongoing leg higher follows mild selling pressure on the Greenback, despite steady uncertainty on the geopolitical front and elevated US inflation.

Gold bleeding continues as Middle East crisis escalates, Fed hike coming

Gold is accelerating its downward trends and approaches the area of $4,100 per troy ounce on Wednesday, where the 2026 bottom sits so far. The persistent decline in the precious metal almost exclusively follows the swelling opinion that the Fed will keep a cautious stance in H2, a view that was reinforced following earlier US CPI data.

$1,500: Why Ethereum just crashed 20% despite spot markets barely selling
Ethereum (ETH) recently suffered one of its sharpest declines of 2026, dropping more than 20% and briefly testing the $1,500 area. While the sell-off appeared to reflect broader market fears, derivatives and on-chain data suggest a more complex story may be unfolding beneath the surface.
Brutal sell-off: Silver deepens months-long slide, refocusing on $60

Silver has never been known for its calm temperament. The precious metal can spend weeks grinding higher before suddenly giving back months of gains in a matter of days. That volatile reputation has been on full display in recent weeks.

The US economy defies the rules: 100 days into the Oil shock and the recession signal is still missing

More than three months after the start of the Iran war and the resulting disruption to global energy markets, the US economy continues to display remarkable resilience. The conflict has triggered a sharp rise in Oil prices, reignited inflationary pressures and fueled widespread concerns about a potential economic slowdown.