NZD/USD climbs above 0.6100 after the US unemployment rate rose
- NZD/USD edges up following a mixed US Nonfarm Payrolls report.
- The Unemployment Rate in the United States edged up, easing pressure on the Federal Reserve to act.
- NZD/USD Price Analysis: It is still downward biased but could test 0.6200.

NZD/USD advances sharply following the release of mixed labor market data in the United States (US). Wall Street opened in the red, reflecting a sour sentiment, while the US Dollar (USD) weakened across the FX board. At the time of writing, the NZD/USD advances 0.76% and trades at 0.6142.
Post US NFP money market futures begin to price in a less hawkish Fed
The highlight of the day, the US Nonfarm Payrolls report for February, showed the economy adding 311,000 jobs, exceeding estimates. January’s data was revised down from 517,000 to 504,000. The Unemployment Rate was above estimates of 3.4%, at 3.6%, signaling that the labor market is easing. Average Hourly Earnings grew 4.6%, and the focus shifted toward the US Consumer Price Index (CPI) next Tuesday.
The data weakened the US Dollar, as shown by the NZD/USD climbing from 0.6117 to 0.6140s. Investors’ initial assessment of the report sees the US Federal Reserve (Fed) hiking rates by 25 bps in March., contrarily to a 50 bps increment. Meanwhile, the swaps markets foresee the first rate cut by the year’s end.
During the week, Fed Chief Jerome Powell stated that rates would peak higher, and if data warranted a faster pace of tightening, the US central bank is ready to act. Now that the first tranche of US data is under the belt, Powell and Co. will be focused on next week’s CPI. Traders should remember that the Fed blackout would begin on Friday at 23:59 hrs.
On the New Zealand front, the economic calendar featured Business PMI in New Zealand, which came at 52 above the previous month’s reading of 50.8, rising for two consecutive months after bottoming around 47.4 in November 2022. Manufacturing Sales in NZ plunged 9.9% YoY, its most significant decline since mid-2020.
NZD/USD Technical analysis
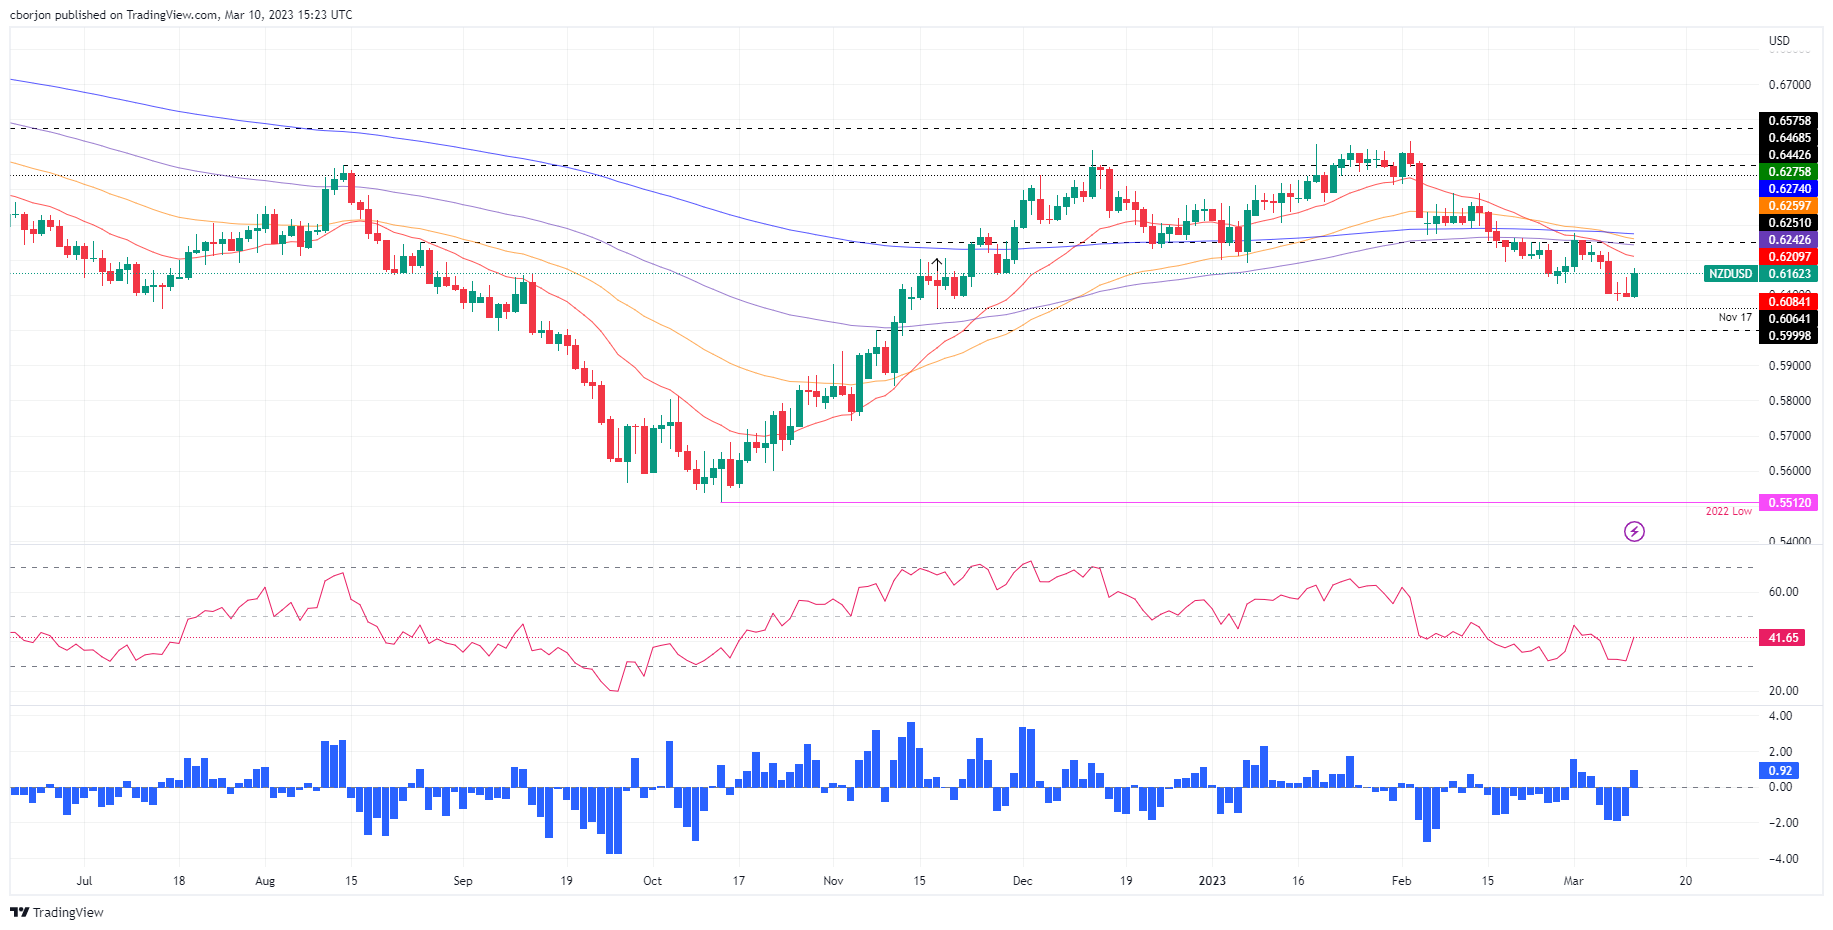
NZD/USD daily chart suggests the downtrend stays intact after a death cross emerged on March 7. That exacerbated the major’s fall to YTD lows of 0.6084. Nevertheless, the uptick in the unemployment rate in the US spurred a jump in the NZD/USD towards the 0.6150s area. If the NZD/USD reclaims the 20-day EMA at 0.6209, that will pave the way toward the 100-day EMA at 0.6242. Otherwise, the NZD/USD could be headed back to 0.6100 before testing the YTD lows.
Author

Christian Borjon Valencia
FXStreet
Markets analyst, news editor, and trading instructor with over 14 years of experience across FX, commodities, US equity indices, and global macro markets.


