NZD/JPY technical analysis: Struggles around 38.2% Fibo., below key resistance-confluence
- NZD/JPY trades near 12-day high amid New Zealand Dollar (NZD) strength, lack of momentum.
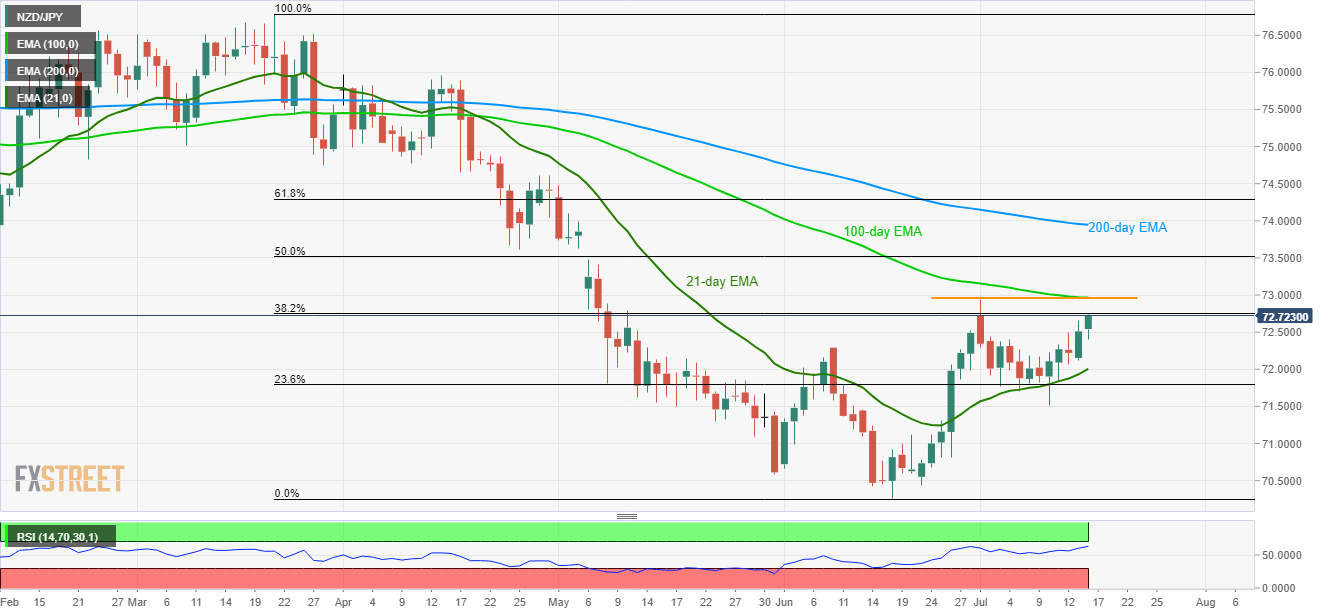
- 100-day EMA, the monthly top can question buyers despite breaking 38.2% Fibonacci Retracement.

With the upbeat New Zealand inflation numbers and overall strength of Antipodeans, the NZD/JPY trades near the highest levels in 12-day while taking the bids to 72.72 ahead of the European markets’ open on Tuesday.
38.2% Fibonacci retracement of March to June declines, at 72.75, acts as immediate resistance for the pair, a break of which can propel the quote towards 72.95/73.00 resistance confluence comprising 100-day exponential moving average (EMA) and the monthly high.
If at all buyers refrain from respecting overbought conditions of 14-day relative strength index (RSI) and cross 73.00 round-figure, 50% Fibonacci retracement level near 73.52 and 200-day EMA figure of 73.95 could be on their radars.
Meanwhile, 72.20 and 21-day EMA level of 72.00 can keep sellers in check ahead of pleasing them with the 23.6% Fibonacci retracement level of 71.79.
In a case where prices slip beneath 71.79, the monthly bottom close to 71.50 and June 20 high near 71.10 could come back on the chart.
NZD/JPY daily chart
Trend: Pullback expected
Author

Anil Panchal
FXStreet
Anil Panchal has nearly 15 years of experience in tracking financial markets. With a keen interest in macroeconomics, Anil aptly tracks global news/updates and stays well-informed about the global financial moves and their implications.


