|

NZD/JPY Price Analysis: Fails to cross short-term hurdle below 79.00 despite RBNZ rate hike

  • NZD/JPY eases after refreshing weekly top, snaps three-day uptrend.
  • RBNZ matches market forecasts of a 25 bps rate hike.
  • 200-DMA restricts immediate downside amid sluggish Momentum line.

NZD/JPY struggles to justify the RBNZ rate hike during early Wednesday. The cross-currency pair initially jumped 40 pips on the Reserve Bank of New Zealand’s (RBNZ) rate hike announcement before attacking the intraday low surrounding 77.50, down 0.05% at the press time.

Read: NZD/USD whipsaws above 0.6950 on RBNZ rate hike

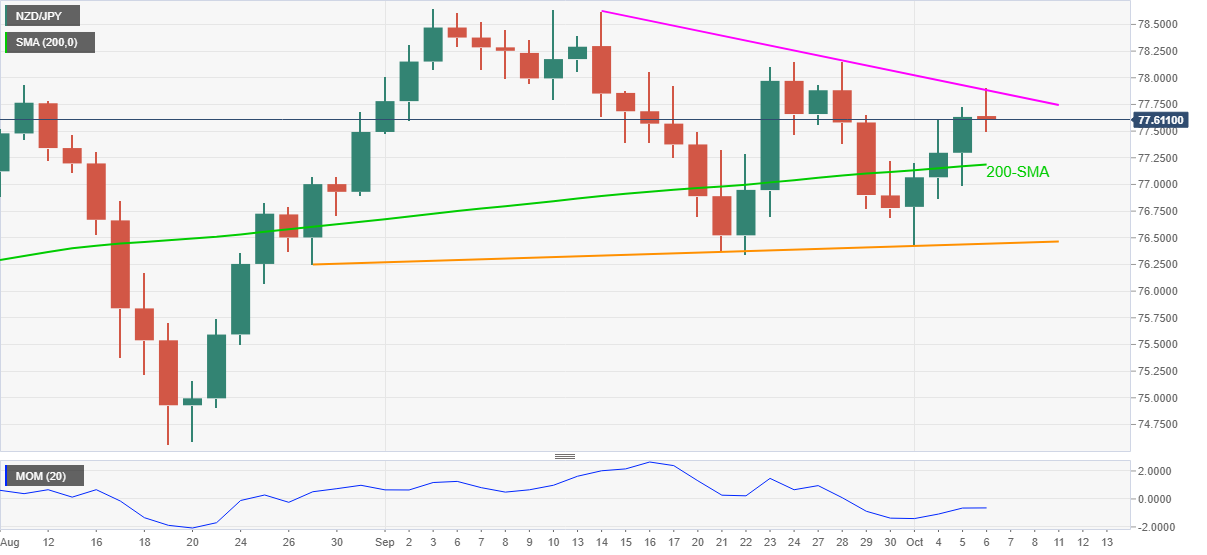
Given the quote’s inability to cross a three-week-old resistance line, coupled with the downbeat Momentum line, NZD/JPY may witness a pullback towards the 200-DMA level of 77.18.

However, any further weakness past 200-DMA will be challenged by an ascending support line from August 27, near 76.44.

During the fall, the 77.00 threshold may offer an intermediate halt whereas September’s bottom around 76.35 adds to the downside filters.

On the contrary, a daily closing beyond the stated resistance line, near 77.90 at the latest, needs validation from the recent swing high close to 78.15 before challenging the last month’s peak surrounding 78.65.

Should the NZD/JPY bulls remain dominant past 78.65, the 80.00 psychological magnet and the yearly high near 80.20 will be in the spotlight.

NZD/JPY: Daily chart

Trend: Pullback expected

Additional impotant levels

Overview
Today last price77.59
Today Daily Change-0.04
Today Daily Change %-0.05%
Today daily open77.63
 
Trends
Daily SMA2077.52
Daily SMA5077.14
Daily SMA10077.53
Daily SMA20077.17
 
Levels
Previous Daily High77.73
Previous Daily Low76.99
Previous Weekly High78.15
Previous Weekly Low76.44
Previous Monthly High78.65
Previous Monthly Low76.34
Daily Fibonacci 38.2%77.45
Daily Fibonacci 61.8%77.27
Daily Pivot Point S177.17
Daily Pivot Point S276.71
Daily Pivot Point S376.43
Daily Pivot Point R177.91
Daily Pivot Point R278.19
Daily Pivot Point R378.66

Author

Anil Panchal

Anil Panchal

FXStreet

Anil Panchal has nearly 15 years of experience in tracking financial markets. With a keen interest in macroeconomics, Anil aptly tracks global news/updates and stays well-informed about the global financial moves and their implications.

More from Anil Panchal
Share:

Editor's Picks

EUR/USD weakens below 1.1700 as Middle East tensions drive US Dollar strength

The EUR/USD pair trades with mild losses around 1.1685, the lowest since late January, during the early Asian session on Tuesday. The US Dollar gathers strength against the Euro as escalating tensions in the Middle East boost safe-haven currencies. The preliminary reading of the Harmonized Index of Consumer Prices from the Eurozone will be published later on Tuesday.  

GBP/USD hovers around 1.3400 with bearish pressure intact

GBP/USD edges higher after three days of losses, trading around 1.3400 during the Asian hours on Tuesday. The technical analysis of the daily chart indicates an ongoing bearish bias, as the pair trades within a descending channel pattern.

Gold defends bids as US-Iran war continues to fuel safe-haven flows

Gold retains positive bias for the fifth consecutive day on Tuesday as rising geopolitical tensions in the Middle East continue to underpin safe-haven assets. However, a bullish US Dollar keeps the bullion below its highest level since late January, set on Monday, warranting caution before positioning for any further appreciation.

Strategy lifts holdings to 3.4% of Bitcoin's total supply amid inflows into crypto products

Strategy continued its accumulation of the top crypto last week, acquiring 3,015 BTC for $204 million amid renewed interest in crypto products after four weeks of outflows.

The market is not panicking it is repricing the probability distribution of Oil and time

At the end of the day, markets do not trade morality or geopolitics. They trade transmission channels. And the only channel that truly matters in this maelstrom runs through the price of energy and the time value of money.

Grass 20% bullish breakout defies broader market weakness

Grass (GRASS) is edging up above $0.30 at the time of writing on Monday. The token’s notable 20% intraday surge stands out amid heightened volatility in the broader crypto market.