|

NZD/JPY Price Analysis: Bulls in control, though face a wall of resistance near 82.50

  • The New Zealand dollar posted gains of 3% vs. the Japanese yen amid a risk-on market mood.
  • The euro and the Japanese yen suffered losses against most G8 currencies.
  • NZD/JPY Price Forecast: The bias is upward, but the steepness of the rally might spur a correction before resuming up.

The NZD/JPY extends its gains in the week, surging in tandem with global equities courtesy of a positive market mood, despite ongoing fighting between Russia – Ukraine. At the time of writing, the NZD/JPY is trading at 82.25

The market mood is positive, as Wall Street closed the trading session with gains. In the FX space, safe-haven peers, except for the Swiss franc, dropped whilst risk-sensitive currencies advanced.

Overnight, the NZD/JPY was subdued around the 81.64 area but jumped once European traders got to their desks, reaching 82.10, a daily high at the time. Late in the day, the market mood improved, lifting the NZD/JPY towards new YTD highs around 82.36.

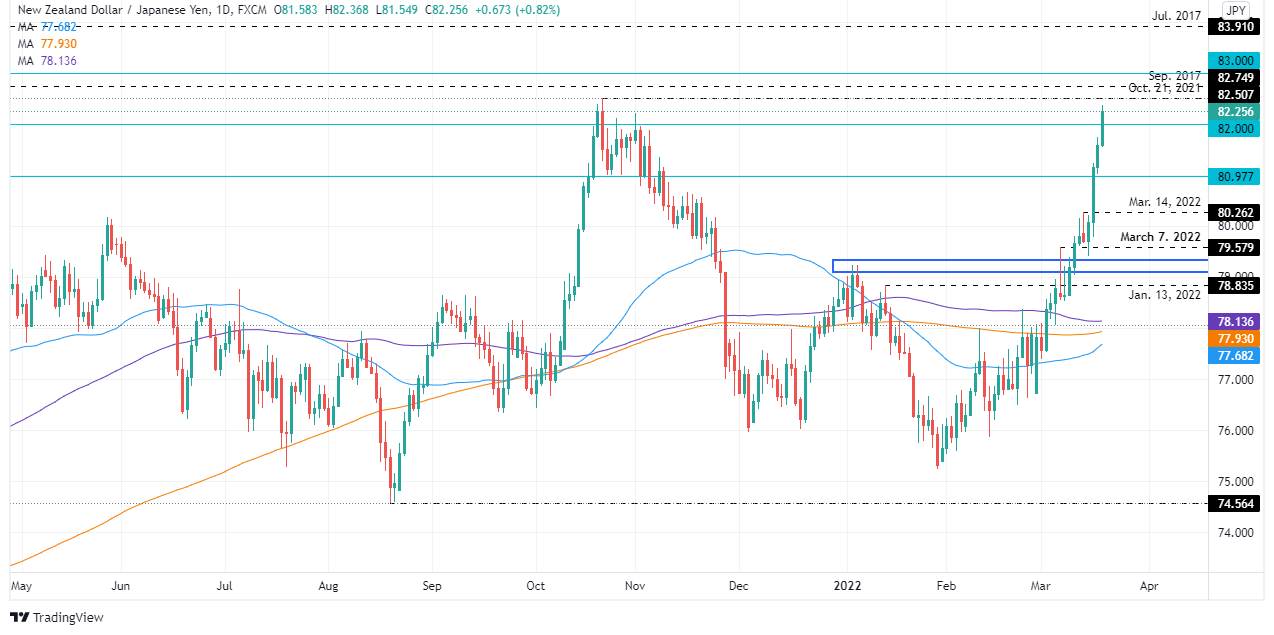
 NZD/JPY Price Forecast: Technical outlook

NZD/JPY uptrend remains intact, despite that the 200-day moving average (DMA) is trapped between the 100 and the 50-DMAs. However, due to the steepness of the move, the cross-currency might aim for a correction before resuming upwards.

If the scenario plays out, the NZD/JPY first demand area would be 82.00. Once cleared, the next support would be 81.00, followed by March 14 daily high at 80.26. On the flip side, on the way north, the NZD/JPY’s first resistance would be September 2017, highs around 82.75, followed by the 83.00 mark, and the July 2017 high at 83.91.

NZD/JPY

Overview
Today last price82.25
Today Daily Change0.72
Today Daily Change %0.88
Today daily open81.61
 
Trends
Daily SMA2078.73
Daily SMA5077.64
Daily SMA10078.17
Daily SMA20077.95
 
Levels
Previous Daily High81.74
Previous Daily Low81.04
Previous Weekly High80.15
Previous Weekly Low78.53
Previous Monthly High78.38
Previous Monthly Low75.53
Daily Fibonacci 38.2%81.47
Daily Fibonacci 61.8%81.3
Daily Pivot Point S181.19
Daily Pivot Point S280.76
Daily Pivot Point S380.49
Daily Pivot Point R181.89
Daily Pivot Point R282.16
Daily Pivot Point R382.58

Author

Christian Borjon Valencia

Markets analyst, news editor, and trading instructor with over 14 years of experience across FX, commodities, US equity indices, and global macro markets.

More from Christian Borjon Valencia
Share:

Editor's Picks

EUR/USD seems fragile below 1.1700 as Middle East war boosts energy prices

The EUR/USD pair trades flat at around 1.1680 during the Asian trading session on Tuesday, but broadly seems vulnerable, being close to its five-week low. The major currency pair is under pressure as surging oil prices due to the United States-Israel war with Iran have increased the risks of higher inflation for the Old Continent.

GBP/USD hovers around 1.3400 with bearish pressure intact

GBP/USD edges higher after three days of losses, trading around 1.3400 during the Asian hours on Tuesday. The technical analysis of the daily chart indicates an ongoing bearish bias, as the pair trades within a descending channel pattern.

Gold cheers US-Iran geopolitical escalation

Gold is finding renewed bids in Asian trades on Tuesday, making another attempt to regain the $5,400 level amid persistent demand for safe-haven assets as the Iran war extends. A softer risk tone remains in play as US President Donald Trump continues to threaten deeper escalation to the ongoing war with Iran, warning that a “big wave” is yet to come.

Top Crypto Gainers: Near Protocol, Virtuals Protocol, and Morpho lead market recovery

Near Protocol, Virtuals Protocol, and Morpho are leading the market recovery with double-digit gains over the last 24 hours. Technically, NEAR extends the breakout of the falling channel pattern, VIRTUAL holds above the 50-day EMA, while MORPHO tests a crucial resistance. 

The market is not panicking it is repricing the probability distribution of Oil and time

At the end of the day, markets do not trade morality or geopolitics. They trade transmission channels. And the only channel that truly matters in this maelstrom runs through the price of energy and the time value of money.

Grass 20% bullish breakout defies broader market weakness

Grass (GRASS) is edging up above $0.30 at the time of writing on Monday. The token’s notable 20% intraday surge stands out amid heightened volatility in the broader crypto market.