Nvidia Stock News and Forecast: NVDA stock set for more losses after GOOGL hits tech and NFLX hits subscribers
- NVDA stock crashes 6% on Tuesday in line with broad market sell-off.
- Nasdaq and other main indices finish Tuesday lower.
- Nvidia suffering a tech sector sell-off with NFLX and now GOOGL disappointing.

Tuesday saw fears mount for the health of the global economy and with a catalyst of geopolitical events in place the scene was set up for another leg lower in equities, which dragged Nvidia stock down by 6% on the day. The market had been nervous ahead of earnings from Microsoft and Google and closed lower by nearly 3% for the S&P 500 and nearly 4% for the Nasdaq. Fears over the growing conflict in Ukraine escalating did not help and news that Russia turned off the gas taps to Bulgaria and Poland also weighed on investor's minds.
The news after the bell was mixed with Google missing earnings while Microsoft reported a strong set of numbers. Tesla (TSLA) did not endear itself to index followers with a huge fall following the proposed takeover of Twitter by Elon Musk.
NVDA stock news: General headwinds hitting Nvidia
So clearly then most of Tuesday's price action was macro and geopolitical and indeed there was little news flow directly attributable to Nvidia. Things will not get any easier on Wednesday as earnings from Facebook (FB) approach. Last time out Facebook earnings led to the largest market cap loss in history so tech investors are understandably nervous.
NVDA stock forecast: Death cross exacerbates break below $206
We feel the risk-reward is skewed to the upside as negative news is now largely factored in. Anything surprising to the upside from Facebook could turn the whole stock market around. More bad earnings from Facebook will probably see a decline in the region of 3-5% but a strong report could see a 10% plus rally we believe.
Looking at the technicals, we identified $206 earlier this week as the key level and how remaining below this would lead to more losses. We did not expect to be so accurate in such a dramatic fashion but a combination of technical selling and macro related outflows did the trick. $206 remains our pivot. We also got the dreaded death cross in NVDA stock, when the 50-day moving average crosses the 200-day. Often cited as a very bearish indicator and it has worked out here.
The weekly chart below shows us the massive support at $130. The huge volume profile bar (green on the left of the chart) shows what a strong level this is. This was the staging point for the massive pandemic rally from March 2020 to November 2021. This is the target as long as NVDA stock remains below $206.
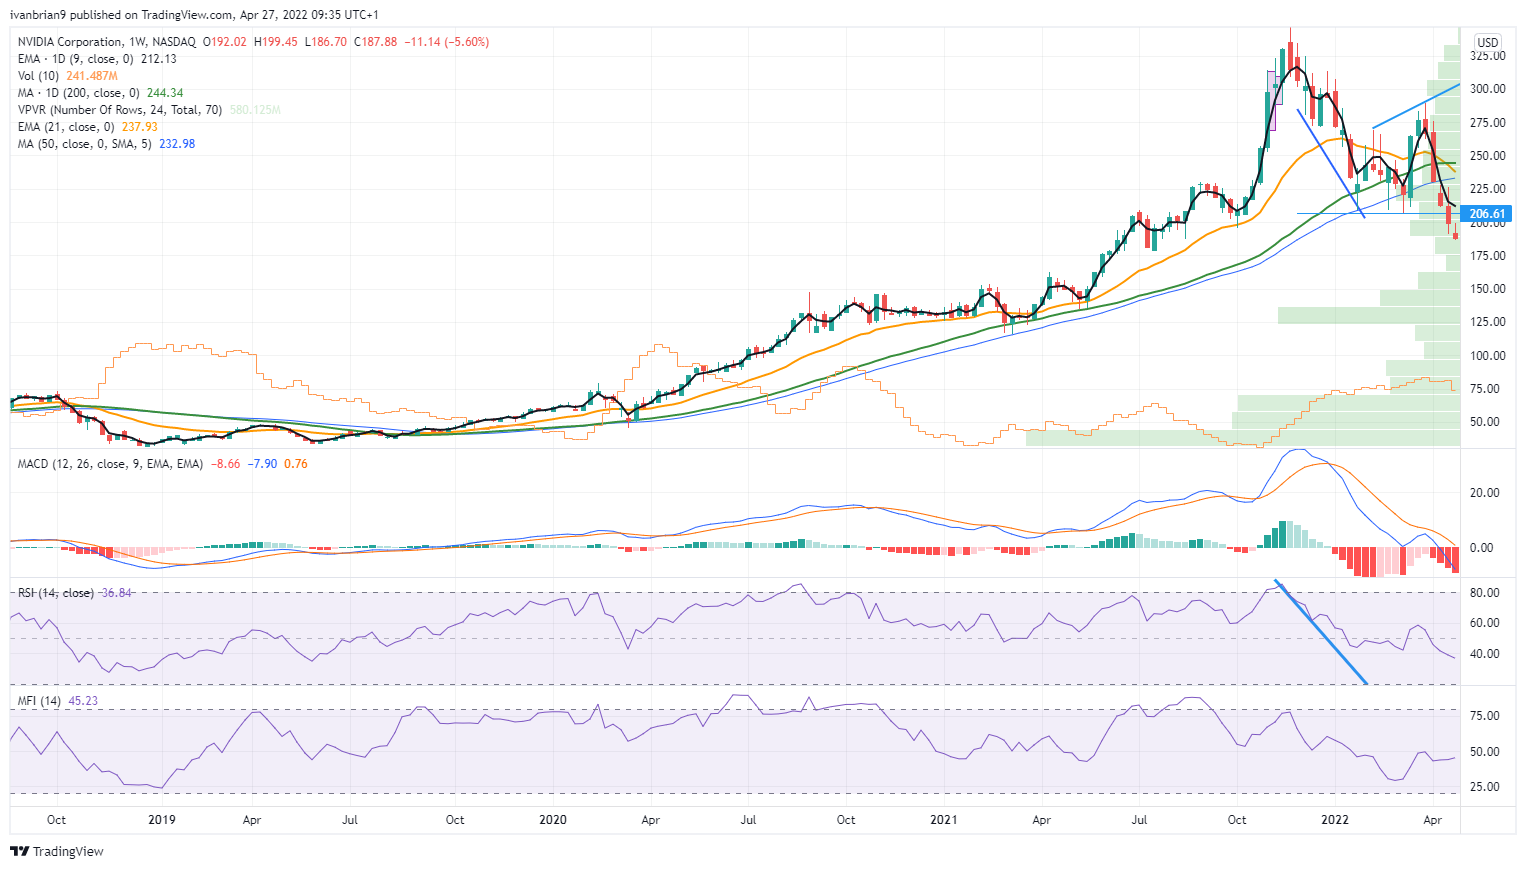
NVDA weekly chart
*The author is short Tesla.
Premium
You have reached your limit of 3 free articles for this month.
Start your subscription and get access to all our original articles.
Author

Ivan Brian
FXStreet
Ivan Brian started his career with AIB Bank in corporate finance and then worked for seven years at Baxter. He started as a macro analyst before becoming Head of Research and then CFO.


